Gerald
POLLACK
Structured Water
Structured Water
Videos
Dr. Mercola : Exclusion Zone Water
US2014137914 : METHOD AND SYSTEM FOR GENERATING ELECTRICAL ENERGY FROM WATER
US2011097218 : METHOD AND APPARATUS FOR GENERATING A FLUID FLOW
US2011036780 : METHOD AND APPARATUS FOR COLLECTING FRACTIONS OF MIXTURES, SUSPENSIONS, AND SOLUTIONS OF NON-POLAR LIQUIDS
US 7819259 / US7793788 : SEPARATING COMPONENTS OF AQUEOUS MIXTURES, SUSPENSIONS, AND SOLUTIONS
http://www.structuredwaterunit.com/Dr_Gerald_Pollack.html
Dr.
Gerald Pollack and Structured Water Science

Dr. Gerald Pollack, University of Washington professor of bioengineering, has developed a theory of water that has been called revolutionary. He has spent the past decade convincing worldwide audiences that water is not actually a liquid.
Dr. Pollack received his PhD in biomedical engineering from the University of Pennsylvania in 1968. He then joined the University of Washington faculty and is now professor of bioengineering. For years, Dr. Pollack had researched muscles and how they contract. It struck him as odd that the most common ideas about muscle contraction did not involve water, despite the fact muscle tissue consists of 99 percent water molecules.
Water Research happens at Pollack Laboratories, which states, "Our orientation is rather fundamental -- we are oriented toward uncovering some of nature's most deeply held secrets, although applications interest us as well."
Uncovering nature's secrets involving water is what Dr. Pollack, his staff and students do best.
In his 2001 book, "Cells, Gels and the Engines of Life," Dr. Pollack explains how the cell functions. Research suggests that much of the cell biology may be governed by a single unifying mechanism - the phase transition. Water is absolutely central to every function of the cell - whether it's muscle contraction, cells dividing, or nerves conducting, etc.
This extraordinary book challenges many of the concepts that have been accepted in contemporary cell biology. The underlying premise of this book is that a cell's cytoplasm is gel-like rather than an ordinary aqueous solution.
The key to Dr. Pollack's entire hypothesis lies in the properties of water. The water molecules become structured in arrays or strata when they interact with charged surfaces such as those presented by proteins. The cell's water is potentially structured. Water stays put in the cells because it's absorbed into the protein surfaces. Structured water adheres to the proteins of the cells.
Structured water does not have the same properties as bulk water. Water is the carrier of the most important molecules of life, like proteins and DNA. In the book, "Cells, Gels and the Engines of Life," evidence is presented that shows water is absolutely essential to everything the cell does. The water in our cells is not like water in a glass. It's actually ordered pretty much like a crystal. Like ice, it excludes particles and solutes as it forms. The space formed is called an exclusion zone (EZ).
Evidence that exclusion zone water/structured water is physically different from bulk water (H2O) :
Structured
water forms an exclusion zone that excludes particles and
solutes.
Dr. Pollack discovered a new phase of water. Bulk Water is H2O but this new phase of water, the exclusion zone structured water, is H3O2. It's a newly discovered phase of water. If you count the number of hydrogen's and oxygen's, you find out it's not H2O.
Structured water is hexagonal crystalline structure between liquid water and crystal.
Hexagonal
structured crystal sheet

H3O2 molecular level

Structured Water forms (honeycomb) hexagonal sheets very similar to ice because it's the next phase! Structured Water (liquid crystalline) is H3O2 . . . the fourth phase of water. It's a transition stage between water and ice.
The Fourth Phase of Water / EZ Water / Structured Water
The reason this fourth phase of water is called the exclusion zone or EZ is because the first thing Dr. Pollack's team discovered is that it profoundly excludes things. Even small molecules are excluded from structured water. Surprisingly, structured water appears in great abundance, including inside most of your cells. Even your extracellular tissues are filled with this kind of water.
Where can we get structured water?
Spring water -- under pressure (deep in the ground) becomes structured.
Glacial melt -- ice turns into Structured Water (EZ water) when melting . . . The phase between liquid and solid is structured water.
Vortexing -- A vortex occurs naturally in nature, as in streams, rivers, waterfalls, etc. The vortex is a kind of mechanical perturbation or agitation. Vortexing is a very powerful way of increasing structure. There are devices on the market which vortex water. One such device is the Natural Action Structured Water Unit.
Juicing -- is water that comes from the plant cells. Structured juice water!
Antioxidents -- Most of the tissues in our body are negative. Our cells are a negative charge; oxidants are a positive charge. Antioxidents maintain the negative charge in our body.
Sunlight -- critical to our health. Light builds Structured Water (EZ water.)
Circulation -- Red blood cells work their way through capillaries; light is the driver of flow. Add light and flow increases. Something other than the heart (pressure) is driving the blood.
Infared light -- energy is generated everywhere. It drives the processes in your body.
The fourth phase of water: starts with the basics of what we know about water . . . from simple experiments we figure out this fourth phase of water. What's the nature of this fourth phase? Why is this interesting? It applies to everything water touches. It's in the sky and the clouds. It's in the oceans, lakes and rivers, and it fills the inside of our body.
Sources:
Pollack, Gerald H., PhD. Cells, Gels, and the Engines of Life. Seattle. Ebner and Sons Publishers. 2001. Print.
Dr. Pollack's science and testing methods:
Pollack, Gerald H., PhD. The Fourth Phase of Water, Beyond Solid, Liquid, and Vapor. Seattle. Ebner and Sons. Publishers. 2013. Print.
Over the years Dr. Pollack has compiled a list of over 200 publications. His 1990 book, Muscles and Molecules: Uncovering the Principles of Biological Motion, won an Excellence Award from the Society for Technical Communication; his more recent book, "Cells, Gels and the Engines of Life," won the Societies Distinguished Award. In 2008, he was selected to receive the University of Washington's highest singular distinction: the Annual Faculty Lecturer Award.
Videos
http://www.youtube.com/watch?v=XVBEwn6iWOo
Water, Energy, and Life: Fresh Views From the Water's Edge.
http://www.youtube.com/watch?v=i-T7tCMUDXU
The Fourth Phase of Water: Dr. Gerald Pollack at TEDxGuelph
http://articles.mercola.com/sites/articles/archive/2013/08/18/exclusion-zone-water.aspx
Exclusion
Zone Water
by
Dr. Mercola
by
Dr. Mercola
Water is clearly one of the most important factors for your health—especially when you consider that your body actually consists of over 99 percent water molecules! I sincerely believe water is a really underappreciated part of the equation of optimal health.
I’ve previously interviewed Dr. Gerald Pollack, who is one of the leading premier research scientists in the world when it comes to understanding the physics of water, and what it means to your health.
Besides being a professor of bioengineering at the University of Washington, he’s also the founder and editor-in-chief of a scientific journal called Water, and has published many peer-reviewed scientific papers on this topic. He’s even received prestigious awards from the National Institutes of Health.
His book, The Fourth Phase of Water: Beyond Solid, Liquid, and Vapor, is a phenomenal read that is easy to understand even for the non-professional.
It clearly explains the theory of the fourth phase of water, which is nothing short of ground-breaking. The fourth phase of water is, in a nutshell, living water. It’s referred to as EZ water—EZ standing for “exclusion zone”—which has a negative charge. This water can hold energy, much like a battery, and can deliver energy too.
For years, Dr. Pollack had researched muscles and how they contract, and it struck him as odd that the most common ideas about muscle contraction do not involve water, despite the fact that muscle tissue consists of 99 percent water molecules.
How could it be that 99 percent of the molecules were ignored? How could it be that muscle contracts without involving the water in some way? These questions help catalyze his passionate investigation into water.
So You Think You Understand Water?
Gilbert Ling, who was a pioneer in this field, discovered that water in human cells is not ordinary water (H2O), but something far more structured and organized.
“I began to think about water in the context of biology: if water inside the cell was ordered and structured and not bulk water or ordinary water as most biochemists and cell biologists think, then it is really important,” Dr. Pollack says.
Dr. Pollack’s book also touches on some of the most basic features of water, many of which are really not understood. For example, how does evaporation take place? Why does a tea kettle whistle? Also, despite the fact that conventional science tells us freezing is supposed to occur at zero degrees Celsius, experiments show that it can freeze in many different temperatures down to minus 50 degrees Celsius.
There’s actually no one single freezing point for water! Other experiments show that the boiling point of 100 degrees Celsius (or 212 degrees Fahrenheit) does not always hold true either.
“There’s a famous website1 put together by a British scientist, Martin Chaplin. Martin lists numerous anomalies associated with water,” Dr. Pollack says. “In other words, things that shouldn’t be according to what we know about water...
The more anomalies we have, the more we begin to think that maybe there’s something fundamental about water that we really don’t know. That’s the core of what I’m trying to do. In our laboratory at the University of Washington, we’ve done many experiments over the last decade. These experiments have clearly shown the existence of this additional phase of water.”
The reason this fourth phase of water is called the exclusion zone or EZ is because the first thing Dr. Pollack’s team discovered is that it profoundly excludes things. Even small molecules are excluded from EZ water. Surprisingly, EZ water appears in great abundance, including inside most of your cells. Even your extracellular tissues are filled with this kind of water.
The Water in Your Cells Give Them Their Negative Charge
Other inherent differences between regular water and EZ water include its structure. Typical tap water is H2O but this fourth phase is not H2O; it’s actually H3O2. It’s also more viscous, more ordered, and more alkaline than regular water, and its optical properties are different. The refractive index of EZ water is about 10 percent higher than ordinary water. Its density is also about 10 percent higher, and it has a negative charge (negative electrical potential). This may provide the answer as to why human cells are negatively charged. Dr. Pollack explains:
“Everybody knows that the cell is negatively charged. If you insert an electrode into any of your cells, you’ll measure a negative electrical potential. The textbook says that the reason for this negative electrical potential has something to do with the membrane and the ion channels in the membrane.
Oddly, if you look at a gel that has no membrane, you record much the same potential – 100 millivolts or 150 millivolts negative. The interior of the cell is much like a gel. It’s kind of surprising that something without a membrane yields the same electrical potential as the cell with a membrane.
That raises the question: where does this negativity come from? Well, I think the negativity comes from the water, because the EZ water inside the cell has a negative charge. The same is true of the gel—the EZ water in the gel confers negativity. I think the cells are negatively charged because the water inside the cell is mainly EZ water and not neutral H2O.”
What Creates or Builds EZ Water?
One of the greatest surprises is that the key ingredient to create EZ water is light, i.e. electromagnetic energy, whether in the form of visible light, ultraviolet (UV) wavelengths and infrared wavelengths, which we’re surrounded by all the time. Infrared is the most powerful, particularly at wavelengths of approximately three micrometers, which is all around you. The EZ water can build on any hydrophilic or water-loving surface when infrared energy is available.
It builds by adding layer upon layer of EZ water, and can build millions of molecular layers. This is how it occurs in nature. For example, ice doesn’t form directly from ordinary H2O. It goes from regular water to EZ water to ice. And when you melt it, it goes from ice to EZ water to regular water. So EZ water is an intermediate state.
“Glacial melt is a perfect way to get EZ water. And a lot of people have known that this water is really good for your health,” Dr. Pollack says.
Testing water samples using a UV-visible spectrometer, which measures light absorption at different wavelengths, Dr. Pollack has discovered that in the UV region of 270 nanometers, just shy of the visible range, the EZ actually absorbs light. The more of the 270 nanometer light the water absorbs, the more EZ water the sample contains. EZ water appears to be quite stable. This means it can hold the structure, even if you leave it sitting around for some time. Water samples from the river Ganges and from the Lourdes in France have been measured, showing spikes in the 270 nanometer region, suggesting these “holy waters” contain high amounts of EZ water. According to Dr. Pollack, there’s compelling evidence that EZ water is indeed lifesaving...
EZ Cellular Water Helps Explain Health Benefits of Light and Heat Therapies
Heating equates to applying infrared energy, and Dr. Pollack has found that if you apply infrared, the EZ water builds and doesn’t diminish. The implications of this are profound when you consider the health benefits of sitting in an infrared sauna, for example. Essentially, one of the reasons why infrared saunas make you feel so good is because your body’s cells are deeply penetrated by infrared energy, which builds and stores EZ water. The same goes for light therapy, spending time in the sun, and laser therapy.
“There are various kinds of light therapy using different wavelengths. We found that all wavelengths – some in particular – of light, even weak light, build EZ. If EZ is critical for the health of your cells, which I think is clear, these therapies have a distinct physical chemical basis,” Dr. Pollack explains.
EZ water also provides a mechanism that explains other biological mysteries. For example, Dr. Pollack describes another fascinating finding that further bolsters our understanding of the mechanism of action behind the health benefits of something as simple as exposing your body to the light and heat of the sun:
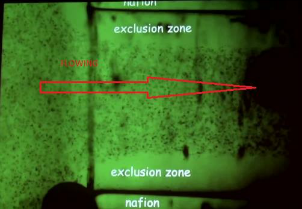
“We found that if we put a simple tube, like a straw, made of hydrophilic material, in water... there’s water flow through the tube at high speed. This happens spontaneously. But it shouldn’t happen spontaneously. The common idea is that if you want to drive fluid through a pipe or tube, you need to apply pressure. But we have no pressure here. There’s no pressure difference between the input and output. But flow builds up spontaneously, and it keeps going.
Recently, we found that if we add light, the flow goes faster. It means that light has a particular effect; especially ultraviolet light, but other wavelengths as well. It speeds up the flow. We think that somehow the exclusion zones (EZs) are involved because inside those tubes, there’s a little annular ring of exclusion zone, and inside that is an area full of protons... It seems that the exclusion zone and the pressure of these protons are driving the flow.”
Now, let’s apply these mechanisms to your body. Your capillaries receive radiant energy from outside all the time. Energy is also received from the inside of your body, as metabolic reactions continuously generate heat or infrared. So the question is, is it possible that the flow of blood occurring through your capillaries is automatically enhanced by exposure to light? It appears the answer may be yes...
“This is an important issue because the capillaries are puzzling,” Dr. Pollack says. “They’re so small. Some of the capillaries are smaller in diameter than the red blood cells that pass through them. Any competent engineer would never build a pipe that’s smaller than the junk that’s supposed to go through. But nature, apparently, has done that...
Now, that means there’s a lot of resistance. You need something to push those red blood cells through... One possibility is that the flow in your capillaries is aided by this kind of radiant energy... We’re starting to test this... It’s possible that your cardiovascular system is assisted by radiant energy in the same way that the flow in the tubes is assisted by radiant energy.”
One of the more interesting healing modalities I’ve been exploring lately is the use of a high-powered laser. The K-Laser also has frequencies in the infrared range, which can deeply penetrate tissue. This kind of laser therapy has shown to provide profound healing for many painful injuries in a very short amount of time—sometimes just minutes of treatment. While the benefits of laser therapy are thought to be due to its action on mitochondrial activity, it may very well be that the benefits are also related to “recharging” your damaged cells’ EZ water, as well as promoting increased capillary blood flow.
EZ water in your body also plays a role is in hyperbaric medicine, which is also good for injuries. In that case, your tissues are exposed to high oxygen under pressure.
“The results are in. We think we understand the mechanism as to why hyperbaric oxygen is so effective for wound healing... EZ water has a higher density than bulk water. If you take H2O and you put it under pressure, it should give you H3O2 because the EZ structure is denser than the H2O. We did the experiments and we found, indeed, that’s the case. If you put H2O under pressure, you get more EZ water.”
The same goes for oxygen. EZ also has more oxygen than H2O, and when you increase oxygen content, you get more EZ water. So, hyperbaric treatment builds EZ water in your body, particularly in injured areas where EZ water is needed.
Alkalinity and Your Body’s Negative Charge May Be Critical for Health
I personally drink vortexed water nearly exclusively as I became a big fan of Viktor Schauberger who did much pioneering work on vortexing about a century ago. Dr. Pollack found that by creating a vortex in a glass of water, you’re putting more energy into it, thereby increasing EZ. According to Dr. Pollack, virtually ANY energy put into the water seems to create or build EZ water.
“We have looked at acoustic energy that seems to effect some change in the water. We’re still not sure exactly what. Vortexed water puts enormous energy into the water. There are several groups in Europe studying this phenomenon right now. “
As mentioned earlier, EZ water is alkaline and carries a negative charge. Maintaining this state of alkalinity and negative charge appears to be important for optimal health. Drinking water can be optimized in a variety of different ways, by injecting light energy or physical energy into the water by vortexing, for example. This is fairly easy using magnets. Reversing the vortex every few seconds may even create more energy.
Clearly, more research needs to be done in this area, but some is already underway. My own R&D team is working on a careful study in which we use vortexed water to grow sprouts, to evaluate the vitality and effectiveness of the water.
As for a natural source of EZ water for drinking, an ideal source is glacial melt. Unfortunately, this is extremely inaccessible for most people. Another good source is water from deep sources, such as deep spring water. The deeper the better, as EZ water is created under pressure. Natural spring water is another excellent way to obtain this type of water and you can use FindaSpring.com to help you find one close to you.
Besides optimizing the water you drink, you can help generate an electron surplus, or support this negative charge within your body, simply by connecting to the Earth, which also has a negative charge. This is the basis of the earthing or grounding technique, which has been shown to have significant health benefits by allowing the transfer of negatively charged electrons from the ground into the soles of your feet. In a sense, it’s as though your cells are built like batteries that are naturally recharged by spending time outdoors — whether sunny or overcast, and walking barefoot, connecting to the negative charge of the earth!
“If you have an organ that’s not functioning wel l— for example, it’s lacking that negative charge — then the negative charge from the earth and... [drinking] EZ water can help restore that negativity. I’ve become convinced... that this negative charge is critical for healthy function,” Dr. Pollack says
PATENTS
METHOD AND SYSTEM FOR GENERATING ELECTRICAL ENERGY FROM WATER
US2014137914
METHOD AND SYSTEM FOR GENERATING ELECTRICAL ENERGY FROM WATER
US2014137914
BACKGROUND OF THE INVENTION
[0003] Satisfying the world's energy needs is a demanding endeavor. Presently, fossil fuels are responsible for supplying the bulk of these worldwide needs. However, fossil fuel supplies are finite, their consumption often has adverse environmental effects, their cost widely variable and somewhat unpredictable, and independence from them is long considered to be politically advantageous.
[0004] Alternative energy sources are being actively sought and developed. Solar and wind energy are attractive alternatives to fossil fuels. Wind farms have been developed and energy from them complements conventional energy supply. The promise of efficient and cost effective solar energy has yet to be realized, although considered to be a future solution to the worldwide energy problem.
[0005] Solar radiation, at its maximum produces about 1000 Watts/m <2>. Solar cells can operate up to 30% efficiency, but typical values of efficiency for the most economical units are about 15-20%. Hence, typical output is about 200 Watts/m <2>, or about 20,000 µW/cm <2 >at full solar radiation. Under more typical lighting conditions, the output would be an order of magnitude lower, about 2,000 µW/cm <2>. Typical photovoltaic output value is about 12,000 µW/cm <2 >at full sun at the equator during the vernal equinox at midday, which is the absolute peak. More typical values, but still under bright conditions, would be an order of magnitude lower, perhaps 1,200 µW/cm <2>. The benchmark for commercial photovoltaic cells in fairly bright light is from about 1,000 to about 2,000 µW/cm <2>.
[0006] Despite the advances made in harnessing energy from the sun, a need exists to develop solar energy systems that provide electrical energy in an efficient and cost effective manner. The present invention seeks to fulfill this need and to provide further related advantages.
SUMMARY OF THE INVENTION
[0007] The present invention provides a method and system for generating electrical energy from a volume of water.
[0008] In one aspect, the invention provides a method for generating electrical energy from a volume of water. In one embodiment, the method includes contacting a volume of water with a hydrophilic surface and applying energy to the volume of water to provide an exclusion zone in the volume of water at the interface of the hydrophilic surface and the water, and a bulk zone in the volume of water outside of the exclusion zone; providing a first electrode in the exclusion zone and a second electrode in the bulk zone; and extracting electrical energy from the volume of water by connecting a load across the electrodes.
[0009] The applied energy can be radiant energy from the sun or infrared radiant energy from a local environment.
[0010] The method for providing electrical energy from a volume of water includes comprising connecting a load across first and second electrodes in contact with a volume of charge-separated water, wherein the volume of water is in contact with a hydrophilic surface in liquid communication with the water defining an exclusion zone at an interface of the hydrophilic surface and the water, and a bulk zone in the volume of water outside of the exclusion zone, wherein the first electrode is in the exclusion zone, and wherein the second electrode is in the bulk zone.
[0011] In another aspect of the invention, a system for generating electrical energy from a volume of water is provided. The system includes a hydrophilic material having a hydrophilic surface; a vessel for receiving the hydrophilic material and a volume of water; a first electrode positioned in the vessel proximate to the hydrophilic surface; and a second electrode positioned in the vessel distal to the hydrophilic surface.
DESCRIPTION OF THE DRAWINGS
[0012] The foregoing aspects and many of the attendant advantages of this invention will become more readily appreciated as the same become better understood by reference to the following detailed description, when taken in conjunction with the accompanying drawings, wherein:
[0013] FIG. 1 is a schematic illustration of a representative system for carrying out a method of the invention;
[0014] FIGS. 2A and 2B are graphs comparing the exclusion zone expansion ratio as a function of wavelength of applied energy; 2A UV-Vis, 2B IR;
[0015] FIG. 3 is a graph illustrating voltage decrease over time in an open circuit with no infrared irradiation;
[0016] FIG. 4 is a graph illustrating current over time in a closed circuit with a 10K resistor;
[0017] FIG. 5 is a graph illustrating voltage over time in an open circuit with infrared radiation;
[0018] FIG. 6 is a graph showing power generated as a function of pH;
[0019] FIG. 7A is an image of an exclusion zone prior to exposure to infrared radiation, the exclusion zone (EZ) is denoted by the absence of microspheres;
[0020] FIG. 7B is an image of the exclusion zone after 5 min exposure to light from LED31-PR; approximate size of incident beam is shown;
[0021] FIG. 8A is a graph comparing exclusion zone expansion ratios as a function of exposure time for three infrared sources (LED17-PR, LED20-PR. and LED31-PR, lower power for LED31-PR);
[0022] FIG. 8B is a graph comparing exclusion zone expansion ratios as function of time during 10 min exposure at different intensities (0.21 mW, 0.34 mW, and 1.20 mW) using LED20-PR;
[0023] FIG. 9A is a graph comparing exclusion zone expansion ratios at different depths during 3.5 min, 5 min, and 7 min exposures of 3.1 µm radiation;
[0024] FIG. 9B is a graph comparing exclusion zone expansion ratios with 5 min exposure to 3.1 11 m radiation focused at a series of distances from a NAFION® surface;
[0025] FIG. 10A is a graph comparing pH change over time following addition of water to a NAFION sheet; pH values were measured at 5 s intervals using a miniature pH probe positioned at three distances from the NAFION sheet (1 mm, 5 mm, and 10 mm); a wave of protons is generated as the exclusion zone forms providing lower pH; at a distance of 1 mm, the pH drop transiently exceeds 3 pH units, which represents a hydrogen ion increase in excess of 1,000 times;
[0026] FIG. 10B is an image of a chamber containing a NAFION tube (bottom) filled with water containing pH-sensitive dye; view is normal to the wide face of a narrow chamber; image obtained 5 min after dye-containing solution was added to the tube; the dark color indicates pH<3; the lighter colors above indicate progressively higher pH levels with near neutrality at the top;
[0027] FIG. 11 is a graph comparing potential (mV) measured as a function of distance from the surface of representative hydrophilic materials (NAFION and poly(acrylic acid) gel) useful in the method of the invention; substances are depicted as “inside” and water is “outside;”
[0028] FIG. 12 is a graph of voltage (V) over time using a platinum cathode and zinc electrode;
[0029] FIG. 13 is a graph corresponding to FIG. 12 showing current (amperes) over time;
[0030] FIG. 14 is a graph of voltage (V) over time using a platinum cathode and zinc electrode using glass slides that are twice (2×) larger than those used to obtain the record shown in FIG. 12; and
[0031] FIG. 15 is a graph corresponding to FIG. 14 showing current (amperes) over time.


DETAILED DESCRIPTION OF THE INVENTION
[0032] The present invention provides a method and system for generating electrical energy from a volume of water. In the method, electrical energy is extracted from the volume of water that is subject to or has been subject to applied energy, such a radiant energy from the sun or the local environment.
[0033] In one aspect, the invention provides a method for generating electrical energy from a volume of water. In one embodiment of the method, a volume of water is contacted with a hydrophilic surface and subjected to the application of energy to provide an exclusion zone at the interface of the hydrophilic surface and the water. A bulk zone in the volume of water is formed outside of the exclusion zone. Charge separation is induced in the volume of water by applying energy to the volume of water. Electrical energy is extracted from the volume of water by providing a first electrode in the exclusion zone and a second electrode in the bulk zone, and connecting a load across the electrodes.
[0034] As used herein, the term “exclusion zone” refers to a region of the volume of water created at the interface of the hydrophilic surface and the water where solutes and particles are excluded. The term “bulk zone” refers to the region of the volume of water outside the exclusion zone. The exclusion zone results from the application of energy (e.g., radiant energy) to the volume of water. The exclusion zone builds with increasing applied energy.
[0035] Application of energy to the volume of water in contact with the hydrophilic surface results in the formation of the exclusion zone. In the process, charge separation is induced in the volume of water. As used herein, the term “charge separation” refers to the physical separation of negative charges (e.g., solutes, particles, ions) from positive charges (e.g., solutes, particles, ions) in the volume of water. In general, the exclusion zone is a region of negative charge and the bulk zone is a region of positive charge (e.g., hydronium ions, free protons).
[0036] The size and shape of the exclusion zone formed in the method of the invention varies greatly depending on the nature of the hydrophilic surface, its size and shape, the nature of the volume of water, and the energy applied. The size of the exclusion zone is variable and dependent on the applied energy: the greater the applied energy, the greater the size of the exclusion zone. The exclusion zone can extend up to a meter or more from the hydrophilic surface. The exclusion zone can therefore extend from the hydrophilic surface any distance from about 1 nm to a meter or more. In certain embodiments, the exclusion zone can extend a distance of from one to two millimeters from the hydrophilic surface. In other embodiments, the exclusion zone can extend a distance of from about 200 µm to about 700 µm from the hydrophilic surface. The shape of the exclusion zone is also variable. For example, when the hydrophilic surface is a sheet positioned against a wall of the vessel containing the volume of water, the exclusion zone extends into the volume of water away from the surface of the hydrophilic surface. When a sheet of material having two hydrophilic surfaces is placed in a volume of water, the exclusion zone extends into the volume of water away from each surface. For a sphere of hydrophilic material having a hydrophilic surface, the exclusion zone extends radially into the volume of water away from the sphere (e.g., shell). In other embodiments, the exclusion zone extends into the volume of water non-uniformly. For examples, the exclusion zone can have the form of a cone narrowing into the volume of water. Exclusion zones having a plurality of cones extending into the volume of water have also been observed. Schematic illustration of the volume of water having exclusion and bulk zones is shown in FIG. 1.
[0037] Exclusion zones were not observed with materials having hydrophobic surfaces, such as silicon rubber, nylon, carbon, quartz, and a plastic paraffin film (PARAFILM®, is a registered trademark of Bemis Co. INC. OF Neenah, Wis.), hereinafter referred to as “PARAFILM”. In general, the materials having surfaces that are highly charged (e.g., sulfonated tetrafluoroethylene copolymer (NAFION 117 polymer), polyacrylic acid gels) exhibit the largest exclusion zones, while those that are least charged (e.g., polyvinyl alcohol gels) exhibit the smallest exclusion zones. (NAFION®, hereinafter referred to as “NAFION” is a registered trademark of E.I. Du Pont De Nemours and Company Corporation of Wilmington, Del.) In all cases, the region beyond the exclusion zone had net positive charge, confirmed by measurements of pH, which showed low pH and therefore high hydrogen ion concentration. In some experiments the pH was as much as four units lower than the original water pH. However, the situation is reversed in the case of positively charged surfaces. These included positively functionalized polystyrene gel beads, and SELEMION® positively functionalized ion exchange resin (SELEMION®, hereinafter referred to as “SELEMION” is a registered trademark of AGC Engineering Co., LTD. of Chiba, Japan). In such cases the potential was 100-200 mV positive at the surface, declining to zero at the edge of the exclusion zone. The bulk water beyond had high pH instead of low pH. In these cases of positively charged surfaces, the exclusion zones were found to be smaller and somewhat more ephemeral than those next to the negatively charged surfaces.
[0038] The volume of water required for the method of the invention is not critical. The method is applicable to nanoscale volumes of water and to expansive volumes of water (e.g., lakes and oceans). The pH of the volume of water can vary (e.g., from about 2 to about 11). It has been observed that relatively more electrical energy can be obtained by the method at low pH (e.g., pH>about 4). The volume of water can include solutes such as salts. Suitable salts include potassium chloride and sodium chloride. Other salts, such as those used in chemical batteries can also be used. The ionic strength of the volume of water can also vary. Ionic strengths up to about 5M have provided reasonable output. Electrical energy has been extracted from volumes of water having ionic strength up to about 5M, and optimal energy has been obtained at ionic strengths from about 100 mM to about 2M.
[0039] In the method, the exclusion zone is formed adjacent to the hydrophilic surface. As used herein, the term “hydrophilic surface” refers to a surface of a material having a contact angle less than 90 degrees for water. The hydrophilic surfaces may be charged or uncharged. The charged hydrophilic surfaces may be mixed charge surfaces. The charged hydrophilic surfaces may have a net positive charge or a net negative charge.
[0040] Suitable materials having hydrophilic surfaces include hydrophilic gels (e.g., polyacrylic acid gels, polyvinyl alcohol gels, polyacrylamide gels, polyHEMA gels, collagen gels, actin gels, and agarose gels), biological materials (e.g., muscle tissue, vascular endothelium, xylem, oxtail tendon, seaweed, and plant root), self-assembled monolayers including carboxyl group-containing monolayers and polyethylene glycol-containing monolayers (e.g., supported on metal surfaces such as gold), polymeric surfaces (e.g., ionomer surfaces) including sulfonic acid-containing polymer surfaces (e.g., sulfonated tetrafluoroethylene copolymer surface also known as NAFION), inorganic surfaces (e.g., surfaces containing titanium dioxide, silicon, zinc, lead, tungsten, aluminum, tin, and mica), and ion exchange resins and materials.
[0041] As noted above, suitable materials having hydrophilic surfaces may have a variety of shapes. In one embodiment, the hydrophilic material is a sheet having a rectangular hydrophilic surface. In another embodiment, the hydrophilic material is a particle (e.g., microsphere or nanosphere). In other embodiments, the hydrophilic material includes a plurality of hydrophilic beads (e.g., mixed charged beads, negatively charged beads, positively charged beads).
[0042] In one embodiment, the hydrophilic material is ice. Exclusions zones have been observed for each of the hydrophilic materials noted above.
[0043] As noted above, in the method, a volume of water is contacted with a hydrophilic surface and subjected to the application of energy. Application of energy increases the size of the exclusion zone. In one embodiment, applying energy includes irradiating the volume of water with electromagnetic radiation. Suitable electromagnetic radiation includes radiation absorbed by the volume of water (e.g., wavelengths in the range from about 200 nm to about 10,000 nm). In the method, infrared wavelengths are the most effective wavelengths. In one embodiment, the radiant energy has a wavelength of about 3 µm.
[0044] The applied energy can be radiant energy from the environment such as solar energy (e.g., ultraviolet, visible, near infrared, and infrared radiation) and heat from the local environment (infrared radiation).
[0045] Although radiant energy is the source of energy applied to the volume of water, in one embodiment of the method, the size of the exclusion zone can be increased by applying a voltage across the electrodes.
[0046] In the method, electrical energy is extracted from the charge-separated volume of water by connecting a load across the first and second electrodes. The nature of the electrodes is not particularly critical. Suitable electrodes include platinum, zinc, aluminum, stainless steel, and copper electrodes. The first and second electrodes may the same or different.
[0047] The load can be connected after a predetermined period of time after inducing charge separation (i.e., after applying energy to the volume of water). Alternatively, the load can be connected during application of energy (e.g., applying radiant energy to the volume of water) in which case electrical energy is extracted from the volume of water at the same time that energy is applied to the volume of water.
[0048] Thus, in one embodiment of the method, electrical energy is extracted from a volume of water by connecting a load across first and second electrodes in contact with a volume of charge-separated water, wherein the volume of water comprises a hydrophilic surface in liquid communication with the water defining an exclusion zone at an interface of the hydrophilic surface and the water, and a bulk zone in the volume of water outside of the exclusion zone, wherein the first electrode is in the exclusion zone, and wherein the second electrode is in the bulk zone. As noted above, “charge-separated water” refers to water in contact with a hydrophilic surface that initiates the formation of the exclusion zone having a net charge opposite that of the bulk zone.
[0049] In another aspect of the invention, a system for extracting electrical energy from a volume of water is provided. In one embodiment, the system includes a hydrophilic material having a hydrophilic surface, a vessel for receiving a hydrophilic surface and a volume of water; a first electrode positioned proximate to the hydrophilic surface; and a second electrode positioned distal to the hydrophilic surface. When the vessel has received a volume of water and energy has been applied to the volume of water, the first electrode is positioned in an exclusion zone formed at the interface of the hydrophilic surface and the water, and the second electrode is positioned in a bulk zone in the volume of water outside of the exclusion zone.
[0050] In one embodiment, the system includes only those components described above (i.e., the system consists of the noted components). In another embodiment, the system includes those components described above and other components that do not alter the characteristics of the system (i.e., the system consists essentially of the noted components). Components that are excluded from this embodiment include components and conditions used in methods for the electrolysis of water, methods for analyzing water samples, and electrochemical analytical and synthetic methods carried out in water.
[0051] FIG. 1 is a schematic illustration of a representative system for carrying out the method of the invention. Referring to FIG. 1, system 100 includes vessel 10 that contains volume of water 12 and hydrophilic material 14 having hydrophilic surface 16. On application of energy (e.g., radiant energy), exclusion zone 20 and bulk zone 22 form in volume of water 12. Electrode 32 is positioned in the exclusion zone and electrode 34 is positioned in the bulk zone. Electrical energy is extracted from the volume of water by applying a load 40 across electrodes 32 and 34. Absent continued application of applied energy, the exclusion zone contracts. Application of energy during the application of a load allows for maintenance of the exclusion zone (i.e., charge separation) and simultaneous extraction of electrical energy. The following provides a further describes the method of the invention. Unexpected phenomenon was observed in water next to hydrophilic surfaces. In a zone up to several hundred micrometers from the hydrophilic surface, solutes were excluded. Subsequent studies showed that the solute-excluding region was physico-chemically different from ordinary water, and probably liquid crystalline. Qualitative differences between this vicinal water and the bulk water farther from the hydrophilic surface were demonstrated using NMR, infrared radiation, and UV-Vis optical absorption. An additional unexpected result was also observed: the excluding region was negatively charged. The potential difference between the vicinal water and water remote was approximately 200 mV, decreasing exponentially with distance from the surface, toward zero potential difference at the end of the exclusion zone.
[0052] The results indicate a loss of positive charge from otherwise neutral water. This lost positive charge was determined to reside in the aqueous zone beyond the exclusion zone. Methods showed a large proton concentration in this bulk region. In dynamic experiments with pH probes, a wave of protons was detected flowing away from the vicinal water and toward the more distant bulk water, as the exclusion zone was growing. The result is charge separation in the water.
[0053] When an entity whose surface is hydrophilic is placed into water, ordering of water molecules next to the surface immediately begins. The ordered entity is negative. As this zone builds, the quantity of negative charge builds. Meanwhile, the complementary positive charges build in the zone beyond this ordered zone to provide charge separation. The charge separation is sustained. In the method of the invention, electrical current is drawn and thereby useful work obtained from charge-separated water.
[0054] In the method of the invention, the buildup of water structure, and hence the separation of charge, is powered by incident radiant energy (i.e., photons). In an experiment, a chamber lined on one side with a hydrophilic surface (i.e., NAFION) was filled with an aqueous suspension of polystyrene microspheres. Within several minutes the microspheres moved away from the surface leaving an exclusion zone. This zone generally remained stable for hours. When light was added the exclusion zone immediately began growing, and within five minutes it had grown substantially. When the light source was extinguished, the exclusion zone returned to its initial size. The effect of incident light is reversible.
[0055] Growth of the exclusion zone was wavelength sensitive. FIGS. 2A and 2B are graphs comparing exclusion zone expansion ratio (defined as the ratio of the exclusion zone width after application of energy to the control state, which is the width of the exclusion zone prior to the application of energy) as a function of wavelength ( 2A UV-Vis and 2B IR). Throughout the ultraviolet-visible range the intensity was maintained constant; and, the same throughout the infrared range (on the order of 100 µW). In the latter series, intensities were lower than in the former series. All wavelengths increased the size of the negative zone, and the increase was wavelength sensitive. The most powerful effect occurred at a wavelength of 3 µm. With mode intensity (271 µW) at 3 µm, in five minutes the exclusion zone (EZ) increased by almost a factor of three.
[0056] It is noteworthy that 3 µm is the wavelength most strongly absorbed by water, and it causes heating. The temperature increase was measured at various points in the chamber. During the five-minute exposure, in no instance did the temperature increase exceed 1° C. demonstrating that any effect of heating must have been secondary. The major impact of these photons appears to be non-thermal, although the exact mechanism (i.e., how the photonic energy brings about ordering of exclusion zone water and charge separation) remains unclear.
[0057] The following experiments determined that electrical power can be drawn from the charge-separated water. The setup included a NAFION sheet, secured within a sandwich of plastic sheets each containing a large open window, so that the NAFION sheet was exposed to water. A stainless steel-mesh electrode was placed immediately adjacent to the exposed NAFION sheet on one side. This served as the negative electrode. The positive electrode, another stainless steel mesh, was placed some distance from the sheet, either on the same, or the opposite side as the negative electrode. The second electrode was positioned so as to lie beyond the exclusion zone. The entire assembly was immersed in water. The two electrodes were either left open circuited, for potential difference measurements, or connected by a load resistor, arbitrarily chosen at 10 Kohms, through which current could flow.
[0058] A potential difference on the order of 100-200 mV was typically recorded. The voltage was high at first, but generally declined with time, depending on whether the load resistor was or was not attached. Importantly, the voltage never fell to zero. A fraction of the initial voltage persisted indefinitely, implying that energy was consistently flowing into the system to recharge the system (infrared energy was continuously available to power the system). FIG. 3 is a graph illustrating voltage decrease over time in an open circuit with no infrared irradiation. FIG. 4 is a graph illustrating current over time in a closed circuit with a 10K resistor.
[0059] Experiments were then undertaken to demonstrate that incident infrared illumination increases power output in the system. FIG. 5 is a graph illustrating voltage over time in an open circuit with infrared irradiation. This data was obtained after the voltage had already diminished considerably from an initial value. Turning on the light caused an immediate (within several minutes) return to the initial (200 mV) voltage, which was sustained even for some time after the light had been turned off.
[0060] Lowering the pH of the volume of water tended to increase power as indicated in FIG. 6. Adding salt to the volume of water induces a substantial positive effect on power production, probably because of the increased conductivity of the solution. Potassium chloride and sodium chloride exert similar effects. In the concentration range 0.1 M to 1 M, power output increased to 150 microwatts. Considering the electrode-surface areas of approximately 3 cm <2>, this increase amounts to about 50 µW/cm <2>.
[0061] Examples of exclusion zones are illustrated in FIGS. 7A and 7B. Referring to FIGS. 7A and 7B, the exclusion zones are adjacent nucleating surfaces and are denoted by the absence of microspheres. As noted above, the exclusion zone is distinct from bulk water. A series of measurements including UV-Vis absorption spectra, infrared and NMR imaging, and electrical polarization showed that water in the exclusion zone was less mobile and more ordered than bulk water, and that it was charged.
[0062] Water is known to have a strong absorption peak at a wavelength 3.05-3.10 µm, corresponding to a symmetric OH stretch. A light source, LED31-PR, which has peak output at 3.1 µm and full width at half maximum (FWHM) of 0.55 µm, was used to irradiate water in contact with a hydrophilic surface. PERMA PURE® NAFION tubing (TT-050, 0.042 in. diam., (PERMA PURE® is a registered trademark of PERMA PURE LLC of Cincinnati, Ohio) was suffused with a 1 µm carboxylate-microsphere suspension (2.65% solids-latex, available from Polysciences Inc. of Warrington, Pa.) with a 1:500 volume fraction, to a depth of about 1 µm. The chamber was made using a thin cover glass adhered to the bottom of a 1-mm thick cover slide with a 9-mm circular hole cut in the center, and was placed on the stage of a microscope (ZEISS AXIOVERT-35, with camera CFW-1310C). (ZEISS® and AXIOVERT® are registered trademarks of Carl Zeiss AG Corp. of Oberkochen, Germany.) A pinhole (available from Edmund Optics of Barrington, N.J.), 50 µm in diameter and 0.25 mm thick, was used to obtain an incident beam of restricted diameter. A fabricated holder integrated the pinhole and LED into a single unit with the LED mounted close to the pinhole. The LED-pinhole axis was vertically oriented.
[0063] When the exclusion zone reached an apparent equilibrium state, the incident radiation was turned on. Optical power output was 33 µW, and the estimated power received through the pinhole was about 2.4 nW. After five minutes, the LED assembly was removed and the exclusion zone was photographed through the microscope. Referring to FIGS. 7A and 7B, it is apparent that even with modest IR exposure, the exclusion zone ( 7B) grew to approximately three times its control size ( 7B).
[0064] Exclusion zone width was also tracked over time. This was carried out not only with the 3.1 µm source, but also with 2.0 µm and 1.75 µm sources (FWHM=0.16 µm and 0.18 µm, respectively). For the latter two sources, intensities were maintained at approximately 190 µW; but for the 3.1 µm source, power was kept at the maximally attainable value, 33 µW.
[0065] During the 10 min exposure at all three wavelengths, exclusion zones continued to expand approximately linearly ( FIG. 8A). The largest effect was seen at 3.1 µm, despite lower incident power. To determine whether the EZ continues to expand beyond the 10-min exposure, the 3.1 µm source was left on at the same intensity as above for up to one hour. The ratios increased from 3.7±0.10 (10 min) to 4.7±0.12 (30 min) and 6.1±0.17 (1 hr) respectively. Hence, the exclusion zone continued to expand for up to at least one-hour of exposure.
[0066] Post-illumination exclusion zone size dynamics were examined. When the infrared light was turned off after 5 minutes exposure, exclusion zone width remained roughly constant with fluctuations for about 30 min. Then, the size of the exclusion zone began decreasing noticeably and continued to decrease for approximately one hour.
[0067] To determine the effect of beam intensity on exclusion zone expansion, the 2 µm source was employed at three power levels, 0.21, 0.34, and 1.20 mW. The rate of EZ expansion increased with an increase of incident power ( FIG. 8B).
[0068] The results demonstrate that exclusion zone expansion is a function of both time and intensity. Exclusion zone growth depends on the cumulative amount of incident energy.
[0069] To test whether the expansion arises out of some unanticipated interaction between the incident radiation and the particular type of microsphere probe, microspheres of different size and composition were tested. For carboxylate microspheres of diameters 0.5 µm, 1 µm, 2 µm, and 4.5 µm at the same volume concentrations (1:500), mean expansion ratios for 5-min exposure of 3.1 µm radiation were: 2.41, 2.97, 3.08, and 3.34, respectively (n=6). For varied 1 µm microspheres made of carboxylate, sulfate (2.65% solids-latex, available from Polysciences Inc. of Warrington, Pa.), and silica (SIO 2, available from Polysciences Inc. of Warrington, Pa.) under conditions the same as above, expansion ratios were 2.97, 3.10 and 1.50. Some material-based and size-based variations were noted; the latter arising possibly because of different numbers of particles per unit volume; but, appreciable radiation-induced expansion was nevertheless seen under all circumstances and with all materials. The presence of the expansion effect is not material specific.
[0070] The effect of illuminating with IR at different positions relative to the NAFION/water interface was compared. For these measurements, a sheet of NAFION 117 film (0.007 in. thick, Aldrich), approximately 6 mm long and 1.5 mm high, was held by a micro-clip (0.75×4-mm jaws, World Precision Instruments) and positioned in the vertical plane near the middle of the chamber, which was made from a rectangular glass block, length 7 cm, width 2.5 cm and height 1.5 mm with a rectangular hole, length 3.15 cm and width 1.2 cm, cut through from top to bottom and a 1-mm-thick glass slide sealing from beneath. The film's upper edge was positioned at the solution surface. The vertical scale was carefully calibrated using a 1-mm-thick glass slide with face markings; one millimeter corresponded to 634 divisions on the focus knob. A 50 µm pinhole was placed immediately above the specimen in order to restrict incident spot size. To estimate spot diameter at different solution depths, a visible source (microscope light with green filter, ?=550 nm) was substituted for the LED. Beam diameters increased approximately linearly from 160 µm at the solution surface, to 240 µm at 1.5 mm below the surface (these values are only approximate, as diameters will change with wavelength). For periods of observation and data collection, where some illumination was required, intensity was minimized by use of this same filter.
[0071] With the beam first positioned in the middle of the exclusion zone, the expansion ratios were measured at different depths. FIG. 9A shows that maximum expansion occurred at a depth of approximately 450 µm from the solution surface, and was detectable well beyond 1 mm. The fact that the maximum expansion occurred well below the surface is surprising given the limited IR penetration ordinarily expected in water.
[0072] With the same setup as above, the spot was then positioned at varying distances from the NAFION-water interface. Results are shown in FIG. 9B. Expansion was largest when light was focused in the center of the exclusion zone, and fell off on either side, although not appreciably. At deeper positions, the near-NAFION expansion peak tended to broaden somewhat, possibly because of incident-beam broadening; but, the trend was essentially similar at all depths. The most notable finding was that even when the beam was positioned far from the NAFION surface, the expansion effect was appreciable.
[0073] Infrared absorption in water causes a temperature elevation. To measure local temperatures, an OMEGAETTE 1M datalogger thermometer HH306 was used, with stainless-steel-sheathed, compact transition ground-junction probe (TJC36 series), small enough (250 µm) to fit within the exclusion zone. (OMEGAETTE® is a registered trademark of Omega Engineering, Inc., of Stamford, Conn.) With the incident beam positioned to elicit the maximum expansion, i.e., centered 175 µm from the NAFION surface, the measured temperature increases are shown in Table 1.
[0000]
TABLE 1
Temperature increases measured at different distances from the NAFION surface after 10 min. exposure to 3.1 µm radiation (n = 3)
Distance Mean temperature increase
175 µm 1.1° C.
250 µm 0.91° C.
350 µm 0.92° C.
4 mm 0.91° C.
6 mm 0.92° C.
[0074] Radiation-induced temperature increases were modest at all positions and fairly uniform over the chamber. Slight temperature variation was found with depth, implying that the thermal mass of the probe itself, immersed by varying extents for measurements at varying depths, did not introduce any serious artifact.
[0075] Dynamics of temperature rise were observed. The temperature increase occurred steadily, reaching a plateau of about 1° C. at 10-15 min after tum-on. This plateau was attained at a time that the exclusion zone continued to expand (see FIG. 8A). Not only was the temperature increase modest, but also the time course of temperature rise and exclusion zone expansion were not correlated.
[0076] Infrared effects were seen at depths on the millimeter scale, whereas infrared penetration into water is anticipated to extend down only on the micrometer scale. One possible explanation is that penetration through the exclusion zone is deeper than through bulk water.
[0077] The exclusion zone expansion's spectral sensitivity was determined. The experimental setup was similar to that described above. The about 200 µm wide light beam emerging from the pinhole was directed to the middle of exclusion zone, and expansion was measured 300 µm below solution surface.
[0078] For the UV and visible sources, maintaining consistent optical power output at all wavelengths was achievable within +/-10% by adjusting the driver current. IR sources were considerably weaker and output power was maintained at a lower level, three orders of magnitude lower than in the UV-visible ranges.
[0079] For ultraviolet and visible ranges all incident wavelengths brought appreciable expansion ( FIG. 2A). The degree of expansion increased with increasing wavelength, the exception being the data point at 270 nm, which was higher than the local minimum at 300 nm. The higher absorption may reflect the signature absorption peak at 270 nm characteristic of the exclusion zone. Clear wavelength sensitivity was also found in the infrared region, the most profound expansion occurring at 3.1 µm ( FIG. 2B). Recognizing that the optical power available for use in the IR region was 1/600 of that in the visible and UV regions, one can assume that with comparable power, the IR curve would shift considerably upward continuing the upward trend evident in FIG. 2A. The most profound effect is in the IR region, particularly at 3.1 µm.
[0080] Interestingly, the overall spectral sensitivity of expansion follows closely the spectral sensitivity of water absorption. In both cases, there is an overall minimum in the near-UV, plus a local maximum at 2.0 µm and a peak at 3.1 µm. If not by coincidence, then a connection is implied between IR absorption and EZ expansion, although the linkage is apparently not through temperature increase, which was both modest and temporally uncorrelated. Furthermore, increasing the bath temperature actually diminishes exclusion zone size. Evidence that the effect is apparently non-thermal.
[0081] FIGS. 10A and 10B present evidence that negative charge buildup next to NAFION is associated with proton buildup in the bulk water beyond. FIG. 10A shows the bulk-water pH transient that occurs during exclusion zone buildup, while FIG. 10B shows the pH distribution in the bulk measured after the exclusion zone had formed. Whereas the exclusion zone is negatively charged, both results, using independent techniques, confirm that the region beyond contains an abundance of protons. Indeed, electrodes placed in the respective zones are able to deliver substantial current to a load confirming charge separation between the exclusion zone and the bulk zone beyond.
[0082] FIG. 11 is a graph comparing potential (mV) measured as a function of distance from the surface of representative hydrophilic materials (NAFION and poly(acrylic acid) gel) useful in the method of the invention; the substances are depicted as “inside” and water is “outside.” Similar negative potentials have been observed with ion-exchange beads composed of crosslinked polystyrene divinylbenzene backbones functionalized with sulfonic acid groups.
[0083] The following is a description of the methods used in the experiments describe above.
[0084] Sample Preparation.
[0085] NAFION surfaces, sheets or tubes, were used for creating exclusion zones. NAFION was immersed in ultrapure water (NANOpure Diamond [trade] 1M p=18.2 MO-cm) to which microspheres were added for delineating the exclusion zone boundary. To supply incident energy, a series of LEDs were used. All experiments were carried out at room temperature in a darkened room.
[0086] Light Sources and Calibration. The LEDs used for infrared illumination (available from Gist Optics Co., LTD. of ChangChun, China) came in T0-18 packages with parabolic reflectors for reducing beam-divergence angle. For the visible range, the LED f 5 series (available from NICHIA Corporation of Tokushima, Japan) was used. For illumination in the UV region, LED model NSHU590 (NICHIA) emitting at 365 nm, and LED models UVTOP® 265 and UVTOP® 295 (available from SENSOR ELECTRONIC TECHNOLOGY, Inc. of Columbia, S.C.) encapsulated in metal-glass T0-39 packages with UV-transparent hemispherical lens optical windows, emitting, respectively, at 270 nm and 300 nm, were used. All LEDs were driven at 2 kHz by a Model D-31 LED driver (available from Gist Optics Co., LTD. of ChangChun, China). Output power was regulated for consistency using a model 1815-C optical power meter (available from NEWPORT Corporation of Irvine, Calif.) equipped with NEWPORT model 818-UV, 818-SL and 818-IR probes.
[0087] In another aspect, the invention provides a method for generating electrical energy from a volume of water through the formation of an exclusion zone at the interface of air and water. In one embodiment of the method, energy is applied to a volume of water contained in a vessel to provide an exclusion zone in the volume of water at the air-water interface and a bulk zone in the volume of water outside of the exclusion zone; a first electrode is provided in the exclusion zone and a second electrode in the bulk zone; and electrical energy is extracted from the volume of water by connecting a load across the electrodes.
[0088] Exclusion zones have been observed not only next to hydrophilic surfaces as described above, but also at the air-water interface of volumes of water contained in vessel having a surface (upper surface) exposed to air. These exclusion zones (i.e., top layer of water on the order of 1 mm) appear to be solute free. In several chamber-geometrical variants, microspheres were consistently excluded from this zone and measurements showed that the zone had a negative potential.
[0089] It is possible that the air is not per se that was responsible for the presence of the exclusion zone and that the exclusion zone was due to the glass surfaces at the chamber's edge. At the glass-water interface the meniscus rise was commonly solute-free, implying the presence of structure. This structure apparently propagates along the water-air interface, covering the water surface. In narrow chambers this cover was commonly 1-2 mm thick, whereas in wider chambers, where the menisci are more widely separated, the structure was thinner. However, replacing air with nitrogen, but not oxygen, diminishes the exclusion zone implying that oxygen may be playing an important role.
[0090] An array of thin glass sheets, positioned parallel to one another and spaced about 1 mm apart, was constructed. The surfaces were oriented perpendicular to the air-water interface, and the top of the array lay immediately beneath the water surface. The negative electrode consisted initially of platinum wires running along the top edge of each member of the glass array, situated just at the air-water interface. The positive electrode, placed at a selectable distance beneath the array, was a platinum mesh.
[0091] Electrical power was extracted from these conditions, just as in the presence of hydrophilic surfaces described above. The drop of voltage, from the initial value to the plateau, was typically only 30-35%, a more modest drop than the situation with immersed hydrophilic surface. Thus, ambient energy could apparently better sustain the power delivery. Absolute power levels were higher. With hydrophilic surface (e.g., NAFION) systems, 1 µA currents with 10K resistor were obtained, while in this aspect, even with the higher resistance 200K resistor used for these experiments, currents on the order of several µA to 10 µA were obtainable, giving power levels in the range roughly 1 µW/cm <2 >of surface (i.e., surface parallel to the air-water interface).
[0092] The effect of incident IR was found to be more consistent albeit less dramatic than in the hydrophilic surface (e.g., NAFION) systems. When IR light was applied from the onset, the drop-off of voltage was slowed by about five or six times; and, the plateau level remained somewhat higher. When the IR was turned on sometime during the plateau, the effect was smaller, sometimes being insignificant, other times causing a slight increase.
[0093] Several experimental variants were evaluated including the use of different types of electrode materials instead of platinum and the addition of salts into the pure water.
[0094] Regarding electrode materials, various combinations of platinum, zinc, aluminum and copper were explored. Depending on the combination, the voltages were either higher or lower than with platinum-platinum. In one advantageous embodiment, the electrode combination was platinum (negative) and zinc (positive), which gave an initial potential difference on the order of about 1 V.
[0095] FIGS. 10A 12- 15 are graphs demonstrating the effectiveness of generating electrical energy from an air-water interface as described above. FIG. 12 is a graph of voltage (V) over time using a platinum cathode and zinc electrode. FIG. 13 is a graph corresponding to FIG. 12 showing current (amperes) over time. FIG. 14 is a graph of voltage (V) over time using a platinum cathode and zinc electrode using glass slides that are twice (2×) larger than those used to obtain the record shown in FIG. 12 (note voltage increase). FIG. 15 is a graph corresponding to FIG. 14 showing current (amperes) over time. When using electrodes of two different metals, rather than the same metals for each electrode, some difference of output power may be due to the metals' electrochemical surface potentials.
[0096] Regarding the addition of salt, modest amounts of salt caused the potential difference to increase. To check the effect, the salt was added in low concentration during the voltage falloff. Voltage magnitude immediately increased, followed by a less steep falloff than in the absence of salt, by 0.2 to 0.3V.
METHOD
AND APPARATUS FOR GENERATING A FLUID FLOW
US2011097218
US2011097218
An apparatus includes a hydrophilic surface configured to drive flow of a polar fluid responsive to an exclusion zone (EZ) effect, the EZ being formed near the hydrophilic surface. An energy source may provide energy to form or maintain the EZ.
BACKGROUND
[0002] Previous academic work has described the phenomenon of an exclusion zone (EZ) generated in proximity to a hydrophilic surface.
SUMMARY
[0003] According to embodiments, methods and applications are described for attaining useful fluid flows in various practical devices. The fluid flows are driven via the generation of an exclusion zone (EZ) in a polar fluid in proximity to a hydrophilic surface. The flows may be produced substantially without conventional energy input, and have been found to persist for extended periods of time.
[0004] According to an embodiment, fluid flow may be maintained responsive to energy absorbed from the environment. Such absorbed energy may be converted to an entropic gradient that maintains the fluid flow.
[0005] According to an embodiment, a fluid flow generator includes a tube having an inner wall, an inlet end, and an output end. A hydrophilic surface formed on at least a portion of the inner wall of the tube. The hydrophilic surface of the inner wall is configured to form a proximate exclusion zone in polar fluid in the tube, and the exclusion zone provides a propulsive force to drive fluid flow from the inlet end to the output end of the tube.
[0006] According to an embodiment, a fluid flow generator includes a tube having an inlet end, an output end, and an inner wall including at least a portion that is hydrophilic; a first fluid reservoir coupled to admit a polar fluid to the inlet end of the tube; and a second fluid reservoir coupled to receive the polar fluid from the output end of the tube. The hydrophilic portion of the inner wall is configured to form an exclusion zone in fluid in the tube, the exclusion zone providing a propulsive force to drive fluid flow from the first fluid reservoir to the second fluid reservoir.
[0007] According to an embodiment, a propulsion system includes a tube having an inlet end, an output end, and an inner wall including at least a portion that is hydrophilic. A mount coupled to the tube may be configured to operatively couple to a propelled vessel. The hydrophilic portion of the inner wall is configured to form an exclusion zone in fluid in the tube, the exclusion zone providing a propulsive force to drive the propelled vessel through a polar fluid.
[0008] According to an embodiment, a method for pumping a polar fluid includes contacting a polar fluid with at least one hydrophilic surface, forming at least one exclusion zone in the polar fluid proximate to the hydrophilic surface, forming a difference in the thickness of different regions of the at least one exclusion zone, and propelling the polar fluid from a volume proximate a thick region of the at least one exclusion zone to a volume proximate a thin region of the at least one exclusion zone.
[0009] According to an embodiment, a method of mixing a fluid includes providing a body having a hydrophilic surface, providing a fluid reservoir configured to hold a polar fluid, providing a polar fluid in the fluid reservoir, and at least partially submerging the body in the polar fluid in the reservoir. The hydrophilic surface of the body forms an exclusion zone in the polar fluid in the reservoir, and the exclusion zone provides a propulsive force to drive fluid flow along the hydrophilic surface.
[0010] According to an embodiment, a body configured to drive polar fluid to flow past the body includes a body having an external surface and a hydrophilic surface formed on at least a portion of the external surface, wherein the hydrophilic surface is configured to form a proximate exclusion zone in polar fluid adjacent the body, and the exclusion zone provides a propulsive force to drive polar fluid flow substantially parallel to the surface of the body.
[0011] According to an embodiment, a method of drawing fluid into a tank includes providing a tank having a hydrophilic inner surface, providing a fluid passage through a wall of the tank, and introducing a polar fluid to the outside of the wall of the tank in the vicinity of the fluid passage. The hydrophilic surface forms an exclusion zone in polar fluid in the tank, the exclusion zone providing a propulsive force to pull the polar fluid into the tank.
BRIEF DESCRIPTION OF THE FIGURES
[0012] FIG. 1 is a diagram of a fluid flow generator, according to an embodiment.
[0013] FIG. 2A is a sectional diagram of a portion of the tube of FIG. 1, according to an embodiment.
[0014] FIG. 2B is a sectional diagram of a portion of the tube of FIG. 1 under conditions of fluid flow past the hydrophilic surface with a differential EZ characteristic, according to an embodiment.
[0015] FIG. 3 is a flow chart summarizing the fluid flow generation process used by apparatuses that operate according to principles described in conjunction with FIGS. 1, 2A, and 2B, according to an embodiment.
[0016] FIG. 4 is a diagram of a fluid propulsion system and a propelled vessel, according to an embodiment.
[0017] FIG. 5 is a diagram of an EZ fluid mixer, according to an embodiment.
[0018] FIG. 6 is a diagram of a system for drawing fluid into a tank using the EZ flow effect, according to an embodiment.
[0019] FIG. 7 is a diagram of a piston engine configured to be driven by an EZ flow effect, according to an embodiment.
[0020] FIG. 8 is a diagram of a multi-stage fluid pump based on principles disclosed herein, according to an embodiment.
[0021] FIG. 9 is a block diagram of an EZ-based power generation system, according to an embodiment.
[0022] FIG. 10 is a photograph of a positively charged hydrophilic bead in a water suspension of negatively charged microspheres.
[0023] FIG. 11 is a series of graphs showing microsphere velocity as a function of distance from the hydrophilic bead surface.
[0024] FIG. 12A is a photograph of a hydrophilic bead at the start of an experiment.
[0025] FIG. 12B is a photograph of the hydrophilic bead of FIG. 12A after 1 hour.
[0026] FIG. 12C is a close-up photograph of the hydrophilic bead of FIG. 12B showing a structure of 0.47 um microspheres attracted thereto.
[0027] FIG. 13 is a photograph showing an EZ formed between a negatively charged bead and negatively charged microspheres.
[0028] FIG. 14 is a set of graphs showing negatively charged microsphere velocity as a function of distance from the negatively charged bead surface.
[0029] FIG. 15A is a photograph of a negatively charged bead surface in a solution of negatively charged microspheres at an initial time t=0.
[0030] FIG. 15B is a photograph of the negatively charged bead surface of FIG. 15A in the suspension of negatively charged microspheres at a time t=2 hours.
[0031] FIG. 15C is a photograph of the negatively charged bead surface of FIGS. 15A, 15B in the suspension of negatively charged microspheres at a time t=5 hours.
[0032] FIG. 15D is a photograph of a negatively charged bead surface of FIGS. 15A-15C in the suspension of negatively charged microspheres at a time t=24 hours.
[0033] FIG. 16A is a photograph of a Nafion tube in a solution of microspheres just before puncture.
[0034] FIG. 16B is a photograph of the Nafion tube of FIG. 16A in the solution of microspheres just after puncture.
[0035] FIG. 17 is a graph of flow rate into the tube of FIGS. 16A, 16B as a function of time.
[0036] FIG. 18 is a graph of flow rates as a function of time into the tube of FIGS. 16A, 16B, first with a single hole and just after puncture of a second hole approximately 1 cm away.
[0037] FIG. 19A is a graph of microsphere flux into the tube of FIGS. 16A, 16B superimposed over relative EZ size inside the tube as a function of time.
[0038] FIG. 19B is a graph of microsphere flux into the tube of FIGS. 16A, 16B superimposed over relative EZ size outside the tube as a function of time.
[0039] FIG. 20 is a graph showing flow of a solution of water and microspheres into the tube of FIGS. 16A, 16B as a function of time with 0.01M NaOH solution inside tube.
[0040] FIG. 21 is a graph showing flow of a solution of water and microspheres into the tube as a function of time with 0.01 M HCl microsphere suspension inside tube.


DETAILED DESCRIPTION
[0041] In the following detailed description, reference is made to the accompanying drawings, which form a part hereof. In the drawings, similar symbols typically identify similar components, unless context dictates otherwise. Other embodiments may be used and/or other changes may be made without departing from the spirit or scope of the disclosure.
[0042] FIG. 1 is a diagram of a fluid flow generator 101 configured to pump a polar fluid between reservoirs, according to an embodiment. The fluid flow generator 101 includes a tube 102 having an inlet end 104, an output end 106, and an inner wall 108 including at least a portion that is hydrophilic. A first fluid reservoir 110 may be coupled to admit a polar fluid to the inlet end 104 of the tube 102. A second fluid reservoir 112 may be coupled to receive the polar fluid from the output end 106 of the tube 102. A fluid flow 114 from the inlet 104 to the output 106 of the tube 102 is maintained responsive to interactions between the polar fluid and the hydrophilic surface 108 of the tube 102. The fluid flow 114 may transfer a polar fluid from the first fluid reservoir 110 to the second fluid reservoir 112. Optionally, a plurality of tubes 102 may be disposed in parallel such that each is configured to receive the polar fluid from the same source first reservoir 110 and output the polar fluid to substantially the same destination second fluid reservoir 112.
[0043] A number of polar fluids were found to exhibit the flow described herein. For example, the polar fluid may include water, a polar fluid with one or more solutes, water with one or more solutes, a polar fluid with one or more suspended particle types, water with one or more suspended particle types, an alcohol, ethanol, a carboxylic acid, acetic acid, dimethyl sulfoxide, or deuterium oxide. For ease of understanding, the polar fluid will generally be referred to as water herein, but it is to be understood that other polar fluids may be substituted.
[0044] Optionally, an energy source 116 may provide energy to maintain fluid flow 114 over an extended period of time or to hasten formation of the EZ. The energy source 116 may be an explicit part of the structure of the fluid flow generator 116. Alternatively, the energy source may be inherent in the ambient environment of the fluid flow generator 116. For example, black body radiation from surrounding objects may provide energy to the tube 102 and the fluid therein.
[0045] The tube 102 may be made of a hydrophilic material such as Nafion or a polyacrylic-acid gel. Nafion is a sulfonated tetrafluoroethylene based fluoropolymer copolymer having a formula:
[0000]
<img class="EMIRef" id="063705001-emi-c00001" />
[0046] The name Nafion will be used herein. It will be understood that compounds related to Nafion may be substituted without departing from the spirit or scope of the claims. Other hydrophilic surfaces may be used in other embodiments. The tube 102 may be horizontal or it may be tilted in the vertical plane by various degrees. In another embodiment, the output end 106 may extend out of the fluid, for example where the surface of the fluid in the second reservoir 112 is below the level of the output 106. For embodiments where the output end 106 is above the surface of the fluid in the second reservoir, the tube 102 may be inclined to raise the fluid to a level above the surface of the fluid in the first reservoir 110. It was found that extending the output end 106 out of the fluid increases the flow velocity significantly. The tube 102 may be cylindrical, elliptical, rectangular, or have other shapes in cross section, for example.
[0047] The fluid level in the first reservoir 110 may be lower than, equal to, or greater than the fluid level in the second reservoir 112. Hence, the fluid can flow against a hydrostatic pressure gradient. The tube 102 may include a plurality of tubes corresponding to plural stages of a fluid transmission or lift distance.
[0048] FIG. 2A is a side sectional diagram of a portion of the tube 102 of FIG. 1, according to an embodiment. The hydrophilic portion (which may include substantially the entirety) of the inner wall 108 is configured to form an exclusion zone (EZ) 202 in a polar fluid in the tube. The EZ provides a propulsive force to drive fluid flow, for example from the first fluid reservoir 110 to the second fluid reservoir 112 shown in FIG. 1.
[0049] Water next to hydrophilic surfaces 108, the EZ 202, has characteristics that differ from bulk water 204. Unlike bulk water 204, the EZ 202 excludes particles and solutes. It is therefore referred to as the exclusion zone or EZ. The EZ 202 may be extensive, and was found to frequently project up to hundreds of micrometers from the hydrophilic surface 108. The EZ 202 is more stable and more ordered than bulk water 204, and it was also found to carry a net charge. The bulk water 204 immediately beyond the EZ 202 was found to be oppositely charged from the EZ 202.
[0050] The separation of charge across an interface 206 between the EZ 202 and the bulk water region 204 may be regarded as a battery cell or capacitor. The electrical potential across the interface 206 can be used to drive current flow. Additionally or alternatively, the potential can generate mechanical work in the form of charge-driven flow by mechanisms described herein. The battery may gain energy by absorbing incident light in a manner akin to a photovoltaic photocell: i.e., light incident on the EZ 202 or regions 204 nearby builds the size of the EZ 202, and hence builds the charge separation. In some experiments, infrared wavelengths were found to be most effective at adding energy to the EZ 202, UV wavelengths were found to be somewhat less effective than infrared, and visible wavelengths were found to be least effective. However, the relative effectiveness of different wavelengths of electromagnetic radiation is still under investigation. Moreover, the EZ 202 was found to form and drive flow even with no explicit source of electromagnetic radiation.
[0051] All EZ-generating surfaces tested thus far produce flow. All non-EZ-generating surfaces such as tubes made of hydrophobic materials failed to produce flow. Surfaces that ordinarily produce exclusion zones but which were subject to conditions in which the EZs are eliminated failed to produce flow. Hence EZ-based features are understood to play a role in the energy-transduction mechanism.
[0052] FIG. 2B is a side sectional diagram of a portion of the tube 102 of FIG. 1 under conditions of fluid flow past the hydrophilic wall 108, according to an embodiment. The EZ 202 is generally an annular region near the hydrophilic wall 108 that in the case of a cylindrical tube 102 is cylindrically symmetric. While FIG. 2B illustrates flow inside the tube 102, similar principles apply in other cases of flow along hydrophilic surfaces. That is, flow can similarly be generated by an EZ 202 formed on an exterior hydrophilic surface. An embodiment of this is described more fully in conjunction with FIG. 5.
[0053] Referring again to FIG. 2B, when the tube 102 was immersed in water or filled with water (or another polar fluid) the annular EZ 202 shown in FIG. 2A established itself along the tube 102. Within minutes, one or more characteristics of the EZ 202 may form a differential value, shown as an exaggerated taper in FIG. 2B. In experiments, it was observed that the size of the EZ 202 diminished with distance along the tube. This was observed with both Nafion tubes and polyacrylic acid tubes. Alternatively, the EZ may not physically taper, but may be characterized by another differential or gradient such as charge mobility, degree of order within the EZ, or another aspect that accounts for energy exchange and the observed flow behavior. Because the flow was experimentally found to coincide with a physical size taper, description and claims will refer to taper and will be modeled as a physical taper herein. However, as used herein, “exclusion zone taper” will be understood to refer to a gradient in an EZ property along the hydrophilic surface. Accordingly, the EZ may taper down from the inlet end 104 to the to the output end 106 of the tube 102.
[0054] One explanation of the observed flow behavior may be understood by reference to the energy contained in a wide EZ versus a narrow EZ 202. The direction of flow through the tube 102 may correspond to flow from a region having a wide EZ to a region having a narrower EZ. Wider EZs may contain more charge than narrower EZs. In observed situations the charge polarity of the EZ was consistently negative; hence, if the near-entry EZ is wider than the near-exit EZ, then the near-entry EZ will contain relatively more negative charge. The near-exit EZ will contain relatively less negative charge.
[0055] According to one explanation, a consideration is the battery-like feature described above. Wherever there is negative charge in the EZ 202, there is corresponding positive charge in the region beyond 204. The corresponding positive charge has been experimentally confirmed. Hence, the core 204 of the tube 102 can contain positive charge. This positive charge may be highest at the entry, lowest at the exit. Whereas the negative charge is embedded in the structural matrix of the EZ, the positive charge is in the form of free hydronium ions, i.e., protonated, or positively charged water; and thus the positive charge is freely mobile. Hence, the concentration of positively charged water ions may be higher at the entry than at the exit. Looked at from one perspective, this charge gradient may drive the water through the tube.
[0056] According to a thermodynamic model, a wide EZ 202 state represents a lower entropy than a narrow EZ 202 state. Fluid in the tube 102 flows left-to-right as illustrated to move from a low entropy state to high entropy state.
[0057] The direction of the taper of the exclusion zone 202 may be random. For example, this may be useful if the tube 102 is used to circulate water in a contiguous tank, such as a single tank or two tanks also coupled by a second passage. The second passage may include an EZ pump or may respond to a slight hydrostatic pressure difference caused by the EZ pump 102. In such an arrangement, the direction of circulation may not be important. Moreover, the direction of flow may or may not correspond to the direction of taper.
[0058] Alternatively, a flow direction generator 208 may be used to generate a direction of flow 114 (shown from left-to-right in FIG. 2B). The flow direction generator 208, shown for simplicity as a separate object, may be intrinsically incorporated into the tube 102 or the hydrophilic surface 108, such as by tapering the tube 102 or providing a differential hydrophilicity or varying the surface area of the hydrophilic surface 108 from one end to the other of the tube 102. Separate flow direction generators 208 may include, for example, a small auxiliary pump, a differentially applied energy source 116, a separate motive power source, etc. The determination of flow direction (including a formation of EZ characteristic differential) is described more fully in conjunction with FIG. 3. The flow direction generator 208 may be an exclusion zone taper generator.
[0059] Alternatively, the pump configuration of FIGS. 1, 2A, and 2B (and other embodiments shown herein) may be used to boost the efficiency or output of a conventional pump. In this mode, a conventional pump may be used to provide a portion of the fluid pumping, with EZ-driven pumping providing additional energy. For example, this approach may be envisioned as an embodiment where the flow direction generator 208 of FIG. 2B includes a conventional fluid pump, but where the flow direction generator is not shut off after establishing the direction of flow.
[0060] FIG. 3 is a flow chart 301 summarizing the fluid flow generation process used by apparatuses that operate according to principles described in conjunction with FIGS. 1, 2A, and 2B, according to an embodiment. In step 302, a polar fluid is received adjacent to a hydrophilic surface. For example the hydrophilic surface may be the inside of a tube, as described above. Alternatively, the hydrophilic surface may be on a body configured to be placed in a tank to cause mixing, or on one or more walls of a fluid passage into or within a tank, as described below.
[0061] Proceeding to step 304, an EZ is established. Establishment of an EZ may occur substantially spontaneously. Alternatively, the EZ may be established in concert with receipt of incident energy by the fluid. It has been experimentally confirmed that EZ formation is particularly responsive to ultrasonic and sonic energy. According to embodiments, electromagnetic radiation, applied sonic energy, and/or other forms of transmitted energy may provide a catalyst function and/or contribute energy to the EZ state. Some or all of the entropic energy of the EZ may correspond to a conversion from molecular kinetic energy corresponding to the temperature of the fluid.
[0062] Next, in step 306, a direction of flow is established. According to some embodiments, for example in mixing applications, the direction of flow through the tube may be of minor importance. For example, the flow of the polar fluid may be bidirectional and the inlet and output ends of the tube may be interchangeable. A straight tube with a uniformly hydrophilic wall, with no impressed motion, and with no differential incident energy from an energy source may exhibit a substantially random flow direction. In such a case, minor temperature gradients or other perturbations to Brownian motion may result in a small net movement of fluid through at least a portion of the tube. In such a case, a very slight EZ characteristic differential may arise. The slight EZ characteristic differential may tend to amplify itself as a greater and greater fluid flow rate increases the slope or difference in the characteristic. The generation of a differential value in an exclusion zone characteristic is shown in step 308. However, one should realize that steps 306 and 308 may proceed substantially simultaneously. Steps 306 and 308 are shown as separate steps for clarity of description. According to experimental observations, the differential characteristic may be the thickness of the exclusion zone.
[0063] Reversal of fluid flow direction has not been observed experimentally. Rather, once flow was established, flow direction remained constant, although variations in flow rate were observed. The Examples provide information regarding observed flow responses.
[0064] Alternatively, the direction of flow may be set. Flow direction can be set in a number of ways. In uniform tubes in a quiescent fluid, flow direction may be unpredictable; but once begun, it continues indefinitely in the initial direction. Flow direction may be set by tapering all or a portion of the tube, such that the tube has a varying diameter. In tapered tubes, flow was confirmed to proceed from large to small diameter; hence flow direction can be set by tapering the tube, either gradually, or more abruptly as in a step function. Alternatively, the wall may be formed with a differential hydrophilicity. More hydrophilic surfaces, e.g., those that are highly charged, were found to generate larger EZs. Hence by grading the degree of hydrophilicity along the tube, either progressively as in a gradient, in a step, or as a combination; one can set flow direction. For example, direction of flow may be set by providing larger hydrophilicity at the inlet end of a surface or tube than the hydrophilicity at the output end of the surface or tube.
[0065] Alternatively, a conventional pump may be configured to set a direction of fluid flow from the inlet end of the tube to the output end of the tube. Once flow is started in a direction, it continues in that direction. Alternatively, the inlet end of the tube may be energized, such as by illumination with higher intensity light than the output end (or the output end may be shaded). The higher intensity light may drive formation of a larger EZ, which may tend to generate a flow direction from the inlet to the output end of the tube.
[0066] As indicated above, the direction of flow has been experimentally observed to correspond to the direction of an EZ taper. Flows have been observed to progress from a region of large EZ thickness to a region or smaller EZ thickness. Accordingly, it has been hypothesized that the observed EZ taper is responsible for driving flow.
[0067] Proceeding to step 310, flow is generated and maintained from the EZ taper. The flow in the tube was observed to continue without substantial diminution of speed, for at least one hour.
[0068] While many experiments were performed without any identifiable energy source 116, it is believed that energy was provided by the environment, for example in the form of incident radiation or inherent in molecular behavior corresponding to temperature, e.g. corresponding to vibrational, rotational, and/or translational movement of fluid molecules.
[0069] Accordingly, the process 301 includes step 312, wherein the fluid in the tube, and the EZ in particular, receives energy from the environment or from an explicit energy source. For example, the tube may be configured to receive radiant electromagnetic energy, sonic energy, or ultrasonic energy and responsively maintain the exclusion zone and the propulsive force. For example, the tube may be configured to receive radiant energy having 3100 nanometers wavelength. The apparatus shown in FIG. 1 (and other apparatuses shown below) may include a radiant energy source 116 configured to provide the radiant energy to the tube. For example the energy source 116 may include an infrared or ultraviolet LED or LED array. Alternatively, an energy source 116 may include a sonic or ultrasonic compression wave source.
[0070] Placement of step 312 is indicated as falling outside the linear progression of steps 302 to 310. According to one interpretation, step 312 may proceed substantially continuously, forming an exchange medium with the entropy state of the EZ and the translational motion of the fluid in the tube 102. According to another interpretation, step 312 may occur in concert with one or more of steps 302 to 310. For example, energy may flow into formation 304 of the EZ 202 and into maintenance of the EZ during fluid flow 310.
[0071] Referring again to FIG. 1, the first and second reservoirs may be operatively coupled for fluid flow therebetween via a flow channel separate from the tube 102. For example, fluid may re-circulate from the output reservoir 112 to the inlet reservoir 110 through another flow generator 101 configured to drive the fluid via the EZ mechanism, through a conventional pump, or via natural flow through a non-powered passage. Alternatively, the first and second reservoirs may be contiguous, such as in a mixer or other apparatus configured to provide flow within a vessel. An example is a fish tank circulation pump.
[0072] The apparatus described in conjunction with FIG. 1 may be used in a variety of applications. For example, the fluid flow generator may be a portion of an irrigation system. Such an application may be represented by the apparatus 101 wherein water in a tank 110 may be transported to sites 112 where it is needed. The transport tubes 102 are hydrophilic and built so that the flow direction is away from the tank 110. In one embodiment these sites 112 are agricultural sites. In other embodiments they are other types of sites 112 requiring water. According to an embodiment, the tank need not be elevated to create hydrostatic pressure. According to an embodiment the driving energy comes from the sun. According to an embodiment, a solar collector may serve as a power source 116 according to the EZ phenomenon. Optionally, a birefringent filter may couple light into the solar collection region in the vicinity of the tube 102. For example, such a filter may couple light at wavelengths to which the EZ responds to the EZ, and couple other wavelengths to other solar energy conversion apparatus(es). Using solar power, source logistics may be simplified. Another advantage is that flow appears likely to be maximal during hot periods, when water is needed most, and minimal during cooler periods when it is needed least. Hence, the delivery could match demand in a natural way, e.g., with no need for the complexities of external flow regulation structure.
[0073] The fluid flow generator may be a portion of a water transport system from an aquifer or cistern. Such an application may be represented by the apparatus 101 wherein water can be transported upward from an underground aquifer, cistern, or container 110 to sites 112 at ground level where it is needed. Such sites may include but are not limited to homes, factories, villages, and agricultural areas. According to an embodiment, no explicit external power source 116 is needed. According to another embodiment, a radiant energy source 116 may provide radiant energy to pump the EZ. Such a source may include a light pipe. In one embodiment the hydrophilic tube 102 runs from the source 110 directly to a collecting tank 112. In another embodiment the water receiving location(s) may correspond to a pipe network or other liquid volume that may not resemble a tank or identifiable bulk reservoir. For example, the intake 110 and output 112 reservoirs may be respectively or commonly comprised of a porous medium. In situations in which the height difference between water source 110 and output 112 is too great, intermediate reservoirs may be staged in a plurality. For example, intermediate reservoirs may be staged at distances corresponding to a desired EZ taper 206 (FIG. 2B). An embodiment of a fluid pump including multiple stages (and intermediate reservoirs) is described more fully in conjunction with FIG. 8.
[0074] The fluid flow generator may be a portion of an infusion device, such as a medical device configured to pump fluid into a human body or within a human body. Such an application may be represented by the apparatus 101 wherein drugs and/or other solutes and fluids may be infused from a chamber 110 to specific body sites 112. The chamber 110 may be situated within the body or adjacent the skin of the person or test subject. The transport tube 102 is made of a biocompatible material. In one embodiment the material is polyHEMA, which, for example, is used in soft contact lenses, and has been shown to exhibit substantial exclusion zones. The infusion may occur without need for a battery or pump separate from the tube(s) 102. The principle is applicable in a situation requiring slow infusion of a polar liquid, with or without dissolved solutes or suspended particles.
[0075] The fluid flow generator may be a portion of a toy or amusement. Because the propulsion mechanism is counter-intuitive, people observing the flow phenomena outlined above are often astonished. The astonishment opens an opportunity for creating children's toys and adult amusements. One embodiment is a boat-like device that self-propels. Another embodiment is a fountain or water feature that spews water upward or sideways or some combination thereof, from a body of water, the latter either natural or supplied in a container 110.
[0076] Further, since artificial light can drive the flow just as well as natural light, the toys and amusements, as well as other devices, can be made to function only when the lights are turned on. This can be achieved by designing the system in such a way that there is a threshold for flow, which is exceeded only when lights are turned on.
[0077] The fluid flow generator may be a portion of a heating system, cooling system, or heating and cooling system. A design constraint in electronic integrated circuit development is heat generation. Because infrared radiation is particularly effective at building EZs, and EZs drive flow, fluid channels built directly into, or around, IC chips may be driven by blackbody radiation, conducted, or convective heat transfer from the integrated circuit and/or packaging. Accordingly, flow rate, which depends on EZ formation, may provide an indication of a rate of radiation, which is dependent upon blackbody temperature. (Adjustments may be made for non-ideal behavior.) According to an embodiment, the tube 102 may form a portion of a temperature sensor.
[0078] When used for heat exchange purposes, a portion of the generated heat (especially one or more portions corresponding to global or local maximum response) may drive flow. The heat transferred to the fluid could thereby pass through a heat exchanger and transfer the heat to the surrounding air.
[0079] Chip cooling may be represented by the apparatus 101 wherein 110 corresponds to a heat source and 112 to a heat sink such as a liquid-to-air heat exchanger. The tube 102 may be formed in an IC or IC packaging in a continuous fashion. The continuous tube may be represented by a second tube (not shown) configured to carry fluid from location 112 to location 110. The tube is filled with water or another polar liquid. The tube may for example be etched substantially square or as a truncated pyramid in the IC substrate. The top may correspond to the IC package. One or more of the top, bottom, or the sides of the tube 102 may be hydrophilic or coated with a hydrophilic material. The other surfaces may be hydrophobic. In some embodiments, directionality does not matter; however, if desired, the water-flow direction may be predetermined by imposing a hydrophilic taper or step function, or size taper or step function.
[0080] The channel 102 may be built into the IC substrate, such as in flow channels etched into the wafer back during or prior to IC manufacture. Since flow can be generated past a single hydrophilic surface, only one of the four flat surfaces of the channel needs to contain the hydrophilic material. This same principle can be applied, in other embodiments, to cool other heat-generating devices such as an engine or motor.
[0081] Alternatively, the fluid flow generator may be a portion of a fluid mixing system. FIG. 5 illustrates one embodiment. Alternatively, the fluid flow generator may be a portion of an aquarium circulation system, which may be represented by FIG. 1, in a manner analogous to applications described above.
[0082] FIG. 4 is a diagram of a fluid propulsion system 401, according to an embodiment. The fluid propulsion system 401, includes a tube 102 having an inlet end 104, an output end 106, and an inner wall including at least a portion 108 that is hydrophilic; and a mount 402 coupled to the tube 102 and configured to operatively couple to a propelled vessel 404. The hydrophilic portion 108 of the inner wall is configured to form an exclusion zone in fluid 406 in the tube, the exclusion zone providing a propulsive force 408 to reactively drive the propelled vessel 404 through a polar fluid 406.
[0083] The tube mount 402 may be configured to couple directly to a hull or body of the propelled vessel 404. For example, the propelled vessel 404 may be a boat, a submarine, a pool or spa skimmer, or an icebreaker.
[0084] The tube 102 may operate substantially as described for the tube of the fluid flow generator described in FIGS. 1, 2A, 2B, and 3, wherein the fluid flow 408 acts as a thrust and wherein the propelled vessel 404 is propelled 410 reactive to the thrust 408. The fluid propulsion system 401 may include a plurality of tubes (not shown), and the mount 402 may be configured to operatively couple the plurality of tubes to the propelled vessel 404.
[0085] In one embodiment, the tubes 102 are coupled to the hull along the sides of the propelled vessel 404, as illustrated. In other embodiments, the tubes 102 may be situated beneath the propelled vessel 404, behind the propelled vessel 404, or in front of the propelled vessel 404. Tubes may be controlled as described above, in conjunction with the fluid flow generator 101. Flow directionality is established in a number of ways. In one embodiment, tapering of the tubes sets the flow direction. In another embodiment flow direction is established by setting up a hydrophilicity gradient along each tube. In yet another embodiment, a small auxiliary pump could set the flow direction.
[0086] Flow rate may be highest when exposure to incident electromagnetic radiation is highest. Thus, higher speed may be obtainable by raising the tubes closer to the water surface, where they may receive relatively more radiation. Flow rate can also be regulated by raising the flow engine so that a fraction of tubes are out of the water, or by regulating the closing/opening of a fraction of the tubes with lids or valves (not shown). Alternatively, the vessel 404 may include conventional power, sail, oar, or paddle driven propulsion. The hull of the vessel 404 may include a hydrophilic coating configured to provide additional propulsion to the vessel 404.
[0087] FIG. 5 is a diagram of an EZ mixer 501, according to an embodiment. A body 502 having a hydrophilic surface 508 may be at least partially submerged in a polar fluid 504. The polar fluid 504 may be held by a fluid reservoir 506. The hydrophilic surface 508 forms an exclusion zone in the polar fluid 504 in the reservoir 506. The exclusion zone provides a propulsive force to drive fluid flow 510 along the hydrophilic surface 508. Alternatively or additionally, the fluid reservoir 506 may be configured with one or more hydrophilic surfaces such as hydrophilic walls (not shown). Mixing of components to achieve uniformity ordinarily requires energy. With the various flow mechanisms described herein, mixing is achievable automatically by hydrophilic surfaces throughout the volume. In one embodiment the surfaces can be hydrophilic tube sections scattered throughout in various spatial arrangements. In another embodiment the hydrophilic surfaces can be vertically oriented slabs, straight or curved. Such arrangements can be used to create flow and thereby facilitate mixing.
[0088] When fluid from a large volume needs to be mixed with fluid in a small container, a method involving a wall penetration may be used as shown in FIG. 6. By implementing such approaches, mixing is achievable with no external energy source other than that from the environment.
[0089] FIG. 6 is a diagram of a system 601 for drawing fluid 602 into a tank 604 using the EZ flow effect, according to an embodiment. A tank or cylinder 604, here shown embodied as a tube having stoppers 606a, 606b in its ends, has a hydrophilic inner surface 108. The tank may be filled with a polar fluid. As described above, the hydrophilic inner surface 108 of the tank 604 builds an EZ 202 proximate the hydrophilic surface. The EZ 202 extends from the hydrophilic surface 108 some distance to an interface 206 with bulk fluid 204.
[0090] A fluid passage 608 is provided through a wall of the tank 604. A polar fluid 602 is provided outside of the wall of the tank 604 in the vicinity of the fluid passage 608. In FIG. 6, this is indicated as the tank 604 being immersed in the polar fluid 602. The hydrophilic surface 108 applies an exclusion zone 202 to polar fluid in the tank, the exclusion zone 202 providing a propulsive force to pull more of the polar fluid via a fluid flow 610 into the tank. For example, the walls of the tank 604 may be elastic. In this case, the incoming polar fluid 602 increases the pressure and/or the volume inside the tank 604 by expanding the elastic walls of the tank 604.
[0091] FIG. 7 is a diagram of a piston engine configured to be driven by an EZ-induced flow effect, according to an embodiment. With reference to FIG. 6, rather than expanding elastic walls or pushing out a stopper 606, the incoming fluid may be used to push a piston 702 inside a cylinder 704 formed with hydrophilic walls 108. An opposing cylinder (not shown) may be formed to push in an opposing direction, or alternatively, the opposing end of the cylinder 704 may be plugged and increasing pressure inside the cylinder 704 may push a single piston 702. The piston 702 may be coupled to a crank 706 via a connecting rod 707. The crank 706 may drive a mechanical load (not shown) such as power generation equipment or other energy consuming apparatus. A plurality (not shown) of pistons 702 may be coupled to the crank 706. One or more pistons 702 may be configured to cooperate with the EZ drive mechanism and valves 708, 710, 714 to provide substantially continuous torque responsive to EZ forces in a corresponding plurality (not shown) of cylinders 704. Alternatively, torque may be applied to the crank 706 intermittently, for example to hold the piston 702 in a constant position during an intake phase of a power cycle.
[0092] One or more fluid exchange valves, which may include an inlet valve 708 and an outlet valve 710 may be timed to admit a solute-containing polar fluid 712 upon which the hydrophilic surface 108 of the cylinder 704 acts to form an EZ 202. During an intake phase, the cylinder may be at substantially constant pressure and minimum volume. The solute-containing fluid 712 flows in through the fluid inlet valve 708 to replace remaining output fluid, which is expelled through the fluid outlet valve 710. The one or more exchange valves 708, 710 are closed after the fluid has been exchanged.
[0093] An EZ 202 forms inside the cylinder 704. Upon formation of the EZ, one or more drive valves 714 opens to admit solute containing drive fluid to the EZ in the cylinder. As described above, the EZ provides a propulsive force (actually an impulsive force) to pull the drive fluid into the cylinder 704. The inflow 716 of solute-containing drive fluid 602 drives the piston 702 to expand the volume inside the cylinder 704. Optionally, the drive valve may include a plurality of fluid inlet passages 714a, 714b configured to sequentially open as the volume of fluid in the cylinder 704 expands during the piston 702 stroke. At the end of the piston stroke, one or more drive valves 714a, 714b may be closed, and the exit valve 710 (which may be combined with the inlet valve 708) is opened to allow the fluid to escape while the piston returns to the minimum volume position. The cycle is then repeated. The cycle may provide unidirectional or reciprocating rotation of the crank 706.
[0094] FIG. 8 is a diagram of a multi-stage fluid pump 801 based on principles disclosed herein, according to an embodiment. Referring again to FIGS. 2A, 2B, for example, a nominal fluid transmission distance may span a single tube 102. Alternatively, the nominal fluid transmission distance may be split into a plurality of stages, each stage configured to transmit the fluid a portion of a transport distance. FIG. 8 illustrates a plurality of stages or portions of stages 802a, 802b, 802c. Each stage 802 includes a corresponding transport tube 102a, 102b, 102c configured to transport a polar fluid responsive to an EZ 202 taper as shown in FIG. 2B. One or more intermediate reservoirs 804a, 804b, 804c receive fluid from a corresponding transport tube 102a, 102b, 102c. The transport tubes 102a, 102b, 102c are configured to provide the fluid to the receiving intermediate reservoir 804a, 804b, 804c across an antisiphon valve 806a, 806b, 806c, which may be formed as an air gap (as shown), a low back-pressure valve, or other apparatus configured to prevent hydrostatic communication between an inlet 104(1) of a first transport tube 102(1) and an output 106n of a last transport tube 102n. Thus, in the case of a vertical stack, each stage only needs to provide EZ taper pumping against the hydrostatic height of the individual stage transport tube (e.g. 102b); or in the case of a horizontal stack, each stage only needs to overcome frictional losses corresponding to the total length of each transport tube.
[0095] The length of each transport tube 102 and each stage 802 may be selected according to a desired EZ slope 206 (FIG. 2B). A larger EZ slope provides greater pumping power, and therefore a higher flow rate. Each transport tube 102a, 102b, etc. empties into a corresponding intermediate reservoir 802a, 802b. A next transport tube 102b, 102c then pulls the fluid from respective intermediate reservoirs 802a, 802b and pumps the fluid, via the EZ flow method described herein, to the next intermediate reservoir in sequence. Accordingly, a sequence of stages 802(1), . . . , 802a, 802b, 802c, . . . , 802n can raise a polar fluid from a first elevation 820 to a second elevation 822 higher than the first elevation 820.
[0096] Referring to FIG. 3, the flow direction of the transport tubes 102 must be established 306, which in turn determines the direction of the EZ taper 308 needed to generate flow 310. The process 306, 308 may be thought of as priming a pump. Similarly, referring back to FIG. 8, the multistage fluid pump 801 is primed to initiate flow. For example, each stage may include one or more vents 808a, 808b formed in a structural tube 810. A priming valve tube 812 may be located circumferential to the structural tube 810 with a lubricant or lubricating interface disposed between the structural tube 810 and the priming valve tube 812. In an initial configuration, the priming valve tube 812 is rotated such that structural tube vents 808a, 808b are misaligned with corresponding vents 814a, 814b in the priming valve tube 812 (configuration not shown). Airspace 816a, 816b, 816c above the nominal surface 818a, 818b, 818c of the respective intermediate reservoirs 802a, 802b, 802c is filled with priming fluid (which may be substantially the same as the fluid to be pumped), which, because the vents 808a, 814a; 808b, 814b; and 808c, 814c are closed, causes the first stage inlet 104(1) to be in hydrostatic communication with the last stage outlet 106n. Accordingly, because the polar fluid is substantially incompressible, a suction pump (not shown) temporarily attached to the last stage outlet 106n can pull fluid through the entire multistage pump 801. After a period of external pumping, the EZs in each transport tube 102(1), . . . , 102a, 102b, 102c, , 102n establish a direction of taper corresponding to upward flow. Upon establishing the flow direction, the priming valve tube 812 is rotated to align the vents 808a, 814a; 808b, 814b; 808c, 814c to allow the airspaces 816a, 816b, 816c to empty to the nominal reservoir surface 818a, 818b, 818c. Optionally, the priming tube vents 814a, 814b, 814c may be positioned and/or elongated to provide sequential opening of the structural tube vents 808a, 808b, 808c for example from bottom to top in order to gradually release each stage 802(1), . . . 802a, 802b, 802c, . . . 802n from bottom to top from suction (priming) pumping to EZ taper pumping, while supporting hydrostatic head with the suction pump (not shown) from the top.
[0097] The multistage fluid pump 801 may thus be lowered to operate as a sump pump, bilge pump, or well pump without providing any active pump at the bottom of the sump, bilge, or well. If prime is lost, the priming tube may be rotated to sequentially close the vents 808 from top to bottom while the polar fluid is pumped down from the top. The priming sequence may then be repeated. Optionally, the multistage fluid pump 801 may be preemptively pumped downward from the top, then re-primed at intervals selected to stop build-up or clean scale or other impurities from the hydrophilic surfaces of the transport tubes 102(1), . . . , 102a, 102b, 102c, . . . , 102n and/or other components.
[0098] The fluid flow method and apparatuses described herein may be used for a variety of purposes. As shown above, the flow may be used to move fluid, to reactively power a watercraft or the like, to mix a fluid, to expand against a pressurized volume, or to power a piston engine. The movement of fluid may also be harnessed to generate power. Such power generation may include or be in addition to or instead of driving electric current using the charge separation effect described above.
[0099] FIG. 9 is a block diagram showing a system 901 for generating electric power from EZ-driven fluid flow, according to an embodiment. An EZ pump 902 pumps fluid from a reservoir 110 to create a fluid flow 114. For example, the EZ pump 902 may be configured as one or more transport tubes 102 (FIGS. 1, 2A, 2B, 8), as a fluid mixing arrangement 501 (FIG. 5), as a fluid pressurizing system 602 (FIG. 6), or as a fluid drive valve 714 and cylinder 704 (FIG. 7). The fluid flow may optionally drive a fluid motion to mechanical motion transducer 904. For example, the transducer 904 may include a piston 702, rod 707, and crankshaft 706 as shown in FIG. 7. The transducer 904 may alternatively include a turbine or other arrangement configured to transfer energy from the fluid flow to mechanical energy. The fluid motion to mechanical motion transducer 904 may couple to a mechanical motion to electrical pressure apparatus 906 such as a generator or alternator, etc. The mechanical motion to electrical pressure apparatus 906 may drive a load or storage device 908 that may, for example, be directly coupled to the apparatus 906 as a dedicated load, or which may alternatively include a power grid.
[0100] In an alternative embodiment, the transducer 904 may be omitted, and the fluid flow 114 may operatively couple 910 to the electrical pressure apparatus 906. For example, the electrical pressure apparatus 906 may include an electro-hydro-dynamic (EHD) transducer that generates current flow responsive to a magnetic field produced by the moving fluid. Alternatively, the electrical pressure apparatus 906 may include electrodes configured to couple to the potential difference between the EZ and bulk fluid described above.
[0101] The pumping effect of an EZ has been measured in several experiments, some of which are presented in examples below.
EXAMPLES
Example 1
Sample Preparation
[0102] The hydrophilic substances used in the experiments included Nafion tubing (TT-050 with 0.042 in. diameter, Perma Pure LLC) and Nafion 117 per-fluorinated membrane (0.007 in. thick, Aldrich). Before use, they were immersed in deionized water for 10 min. All experiments were carried out at 22-23° C. and in a dark room to minimize background noise.
[0103] All experiments used deionized water, which was obtained from a NANOpure® Diamond™ ultrapure water system. The purity of water from this system is certified by a resistivity value up to 18.2 mO-cm, which exceeds ASTM, CAP and NCCLS Type I water requirements. In addition, the deionized water was passed through a 0.2-micron hollow fiber filter for ensuring bacteria- and particle-free water.
[0104] Polybead carboxylate microspheres (2.65% solids-latex, Polysciences Inc.), hydrophilic silica microspheres (SiO2, Polysciences Inc.), and sulfate microspheres (2.65% solids-latex, Polysciences Inc.) were used to delineate the extent of the exclusion zone. The volume fractions of these aqueous microsphere suspensions were set to 1 to 500.
Experimental Setup
[0105] A Zeiss Axiovert-35 microscope was used for all observations. A high-resolution single chip color digital camera (CFW-1310C), well suited for bright-field and low-light color video microscopy, as well as for photo documentation was used for color imaging. It has a pixel resolution of 1360×1024 with a dynamic range of 10 bits. The CCD sensor of that camera employs the widely used Bayer color-filter arrangement.
[0106] Two types of chambers were used. The first was made using a thin cover glass stuck to the bottom of a 1-mm thick cover slide with a 9-mm circular hole in the center; that chamber was used for experiments with Nafion tubing. The second was the same except that the hole was a rectangle of length 3.15 cm×width 1.2 cm×and height 1.5 mm, which was for experiments with Nafion membrane, secured with a “micro-vessel” clip to stand up in the middle of chamber (0.75×4-mm jaws, World Precision Instruments).
Light Source and Incident Power Measurement
[0107] For sample illumination a series of LEDs were used. Infrared LEDs (Gistopics) came in TO-18 packages with parabolic reflectors for reducing beam-divergence angle. For the visible range, LED f5 series (Nichia) was used. And, for illumination in the UV region we used LED NSHU590 (Nichia) emitting at 365 nm, and LEDs UVTOP® 265 and UVTOP® 295 (Sensor Electronic Technology) encapsulated in metal-glass TO-39 packages with UV-transparent hemispherical lens optical windows, emitting, respectively, at 270 nm and 300 nm. All LEDs were driven at 2 kHz by a Model D-31 LED driver (Gistoptics). Output power was regulated for consistency using a Newport 1815-C optical power meter with Newport 818-UV, 818-SL and 818-IR probes.
[0108] To obtain an incident beam of small diameter, a pinhole 50 microns in diameter and 0.25 mm thickness (Edmund Optics) was used. An integrated holder was built to keep the pinhole and LED together as a single unit, the LED positioned as close as possible to the pinhole. In order to maximize incident power, the unit almost touched the chamber's edge.
Temperature Measurements
[0109] To measure the temperature at various points within the chamber, an OMEGAETTE™ datalogger thermometer HH306 with compact transition ground-junction probe (TJC36 series) was used. This is a compact dual-input thermometer whose stainless steel-sheathed probe is small enough (250 µm) to fit within the EZ. Its range extends from -200 to 1370° C.±0.2% and resolution is 0.1° C. The datalogger can store up to 16,000 records at programmed intervals as short as once per second.
Results
[0110] A clue for the source of energy for EZ buildup came after having inadvertently left the experimental chamber on the microscope stage overnight. EZ size had diminished considerably; but after turning the microscope lamp on, EZ size began immediately to increase, restoring itself to the former size within minutes. With preliminary evidence that light could expand the EZ, we investigated systematically whether the energetic source for EZ buildup might indeed be radiant energy.
[0111] Water is known to have a strong absorption peak at a wavelength 3.05 ~3.10 µm, corresponding to a symmetric OH stretch. Hence, the first used light source used was one with peak output at 3.1 µm, LED31-PR, which has full width at half maximum (FWHM) of 0.55 µm.
[0112] Nafion tubing was suffused with a 1-µm carboxylate-microsphere suspension with a 1:500 volume fraction, to a depth of -1 mm. The chamber was made using a thin cover glass stuck to the bottom of a 1-mm thick cover slide with a 9-mm circular hole cut in the center, and was placed on the stage of the microscope. A pinhole was used to obtain an incident beam of restricted diameter. A fabricated holder integrated the pinhole and LED into a single unit with the LED mounted close to the pinhole. The LED-pinhole axis was vertically oriented.
Basic Observations
[0113] After the EZ had grown to a stable size, usually within 5 minutes, the incident radiation was turned on. Optical power output was 33 µW, and the estimated power received through the pinhole was ~2.4 nW. After five minutes, the LED assembly was removed and the EZ was immediately photographed through the microscope. It was apparent that even with modest IR exposure, the EZ grew to approximately three times its control size.
[0114] We also tracked the time course of EZ-width increase. This was carried out not only with the 3.1-µm source, but also with the 2.0-µm and 1.75-µm sources (FWHM=0.16 µm and 0.18 µm, respectively). For the latter two sources, intensities were maintained at approximately 190 µW; but for the 3.1-µm source, power was kept at the maximally attainable value, 33 µW.
[0115] During a 10 minute exposure at all three wavelengths, EZs continued to expand approximately linearly. The largest effect was seen at 3.1 µm, despite lower incident power. To determine whether the EZ continues to expand beyond the 10-min exposure, the 3.1-µm source was left on at the same intensity as above for up to one hour. The ratios increased from 3.7±0.10 (10 min) to 4.7±0.12 (30 min) and to 6.1±0.17 (1 hr) respectively. Hence, the EZ continues to expand with continued exposure for up to at least one hour. Longer durations were deemed unreliable, as evaporation became noticeable; hence measurements were suspended.
[0116] Post-illumination EZ-size dynamics were examined as well. When the infrared light was turned off after 5-minutes exposure, EZ width remained roughly constant with fluctuations for about 30 min; then, it began decreasing noticeably, reaching halfway to baseline levels in typically ~15 minutes.
[0117] To determine the effect of beam intensity on EZ expansion, the 2-µm source was employed at three power levels, 0.21, 0.34, and 1.20 mW. The rate of EZ expansion increased with an increase of incident power.
[0118] EZ expansion is a function of both time and intensity. Hence, EZ growth depends on the cumulative amount of incident energy induced charge separation.
[0119] To test whether the expansion might arise out of some unanticipated interaction between the incident radiation and the particular type of microsphere probe, microspheres of different size and composition were tested. For carboxylate microspheres of diameters 0.5 µm, 1 µm, 2 µm, and 4.5 µm at the same volume concentrations (1:500), mean expansion ratios for 5-min exposure of 3.1-µm radiation were: 2.41, 2.97, 3.08, and 3.34, respectively (n=6). For 1-µm microspheres made of carboxylate, sulfate, and silica under conditions the same as above, expansion ratios were 2.97, 3.10 and 1.50 Hence, some material-based and size-based variations are noted—the latter arising possibly because of different numbers of particles per unit volume; but, appreciable radiation-induced expansion was nevertheless seen under all circumstances and with all materials. Hence, the existence of the light-induced expansion effect is not material specific.
Spatial Illumination Effects
[0120] We also explored the effect of illuminating with IR at different positions relative to the Nafion/water interface. For these measurements, a sheet of Nafion 117 film, approximately 6 mm long and 1.5 mm high, was held by a micro-clip and positioned in the vertical plane near the middle of the chamber. The chamber was made from a rectangular glass block, length 7 cm, width 2.5 cm and height 1.5 mm, with a rectangular hole, length 3.15 cm and width 1.2 cm, cut through from top to bottom and a 1-mm-thick glass slide sealing from beneath. The film's upper edge was level with the solution surface. The vertical scale was carefully calibrated using a 1-mm-thick glass slide with face markings; one millimeter corresponded to 634 divisions on the focus knob. A 50-µm pinhole was placed immediately above the specimen in order to restrict incident spot size. To estimate spot diameter at different solution depths, a visible source (microscope light with green filter, ?=550 nm) was substituted for the LED. Beam diameters increased approximately linearly from 160 µm at the solution surface, to 240 µm at 1.5 mm below the surface. (These values are only approximate, as diameters will change with wavelength.) For observation and data-collection periods, which necessitated some illumination, intensity was minimized by use of this same filter.
[0121] When the beam was first positioned in the middle of the EZ, we measured the expansion ratios at different depths. Maximum expansion occurred at a depth of approximately 450 µm from the solution surface, and was detectable well beyond 1 mm. The fact that the maximum expansion occurred well below the surface is unusual given the limited IR penetration ordinarily expected in water. One possibility is that penetration through the EZ is deeper than through bulk water: EZ-like zones are found at the air-water interface, and if IR radiation does penetrate more deeply through such zones, then the unexpectedly deep effects might be explainable. Indeed, changes in IR-absorption depth are noted in confined geometries, where interfacial, or EZ-like, water is abundant; hence, EZ water may have longer penetration depth than bulk water. Alternatively, the unexpectedly deep effects could arise indirectly: e.g., incident radiation creating ions, free radicals, or other highly reactive entities in the bulk, which are then free to diffuse in all directions, enhancing the downward EZ buildup.
[0122] With the same setup as above, the spot was then positioned at varying distances from the Nafion-water interface. Expansion was largest when light was focused in the center of the EZ, and fell off on either side, although not appreciably. At deeper positions, the near-Nafion expansion peak tended to broaden somewhat, possibly because, of incident-beam broadening; but, the trend was essentially similar at all depths. The most notable finding is that even when the beam was positioned far from the Nafion surface, the expansion effect was appreciable.
Controls for Temperature
[0123] Infrared absorption in water causes a temperature elevation. Hence, we considered the possibility that the expansion might arise from an appreciable increase of chamber temperature. To measure local temperatures, an OMEGAETTE™ datalogger thermometer HH306 was used, with stainless-steel-sheathed, compact transition ground-junction probe (TJC36 series), small enough (250 µm) to fit within the EZ. With the incident beam positioned to elicit the maximum expansion, i.e., centered 175 µm from the Nafion surface, the measured temperature increases are shown in Table 1. Radiation-induced temperature increases were modest at all positions and fairly uniform over the chamber. We also found little temperature variation with depth, implying that the thermal mass of the probe itself, immersed by varying extents for measurements at varying depths, did not introduce any serious artifact.
[0000]
TABLE 1
Temperature increases measured at different distances from the Nafion surface after 10 min. exposure to
3.1-µm radiation (n = 3)
Mean
Distance from temperature
Nafion increase
175 µm 1.1° C.
250 µm 0.91° C.
350 µm 0.92° C.
4 mm 0.91° C.
6 mm 0.92° C.
[0124] Further to this point, we recorded the dynamics of temperature rise. The temperature increase occurred steadily, reaching a plateau of -1° C. at 10-15 min after turn-on. This plateau was attained at a time that the EZ continued to expand. Hence, not only was the temperature increase modest, but also the time course of temperature rise and EZ expansion were not correlated.
Spectral Analysis
[0125] A principal objective was to determine EZ-expansion's spectral sensitivity. The experimental setup was similar to that described above. The ~200-µm wide light beam emerging from the pinhole was directed to the middle of EZ, and expansion was measured 300 µm below solution surface. For the UV and visible sources, maintaining consistent optical power output at all wavelengths was achievable within +/-10% by adjusting the driver current. But IR sources were considerably weaker; hence output power was maintained at a lower level, three orders of magnitude lower than in the UV-visible ranges. Spectral results are therefore plotted separately.
[0126] For UV and visible ranges all incident wavelengths brought appreciable expansion. The degree of expansion increased with increasing wavelength, the exception being the data point at 270 nm, which was higher than the local minimum at 300 nm. The higher absorption may reflect the signature absorption peak at 270 nm characteristic of the EZ. Clear wavelength sensitivity was also found in the IR region, the most profound expansion occurring at 3.1 µm. Recognizing that the optical power available for use in the IR region was 1/600 of that in the visible and UV regions, one can assume that with comparable power, the IR curve would shift considerably upward. Hence, the most profound effect is in the IR region, particularly at 3.1 µm.
[0127] For building the EZ, incident IR must induce some change in bulk water, the most likely manifestation of which is molecular dissociation. It is already established that next to anionic surfaces the EZ is negatively charged. We observed evidence that negative charge buildup next to Nafion is associated with proton buildup in the bulk water beyond. Whereas the EZ is negatively charged, the region beyond the EZ appears to be positively charged. In other words, incident electromagnetic energy appears to split water into negative and positive moieties, creating potential energy.
Discussion
[0128] The most significant result of this study is that the near-surface exclusion zone expands extensively in the presence of radiant energy. That is, growth of this more ordered, negatively charged zone is dependent on incident electromagnetic energy.
[0129] The overall spectral sensitivity of expansion follows closely the spectral sensitivity of water absorption. In both cases, there was an overall minimum in the near-UV, plus a local maximum at 2.0 µm, and a peak at 3.1 µm. If not by coincidence, then a connection is implied between IR absorption and EZ expansion—although the linkage is apparently not through temperature increase, which was both modest and temporally uncorrelated. Further to this point, increasing the bath temperature actually diminishes EZ size (unpublished observations). Hence, the effect of incident electromagnetic energy is apparently non-thermal.
Mechanistic Considerations
[0130] A question is how radiant energy could augment EZ size. This question rests on the more basic question of the energy responsible for the original EZ buildup, for buildup and augmentation may be driven from the same energetic source. Since infrared energy is consistently available under non-extreme conditions, IR energy is likely to be the agent responsible for both the initial buildup and the augmentation.
[0131] To build the EZ, bulk water must undergo some kind of change. We found that as the negatively charged EZ builds, the concentration of protons in the region beyond the EZ likewise builds. Two independent techniques confirm this. Indeed, electrodes placed in the respective zones are able to deliver substantial current to a load, confirming genuine charge separation between the EZ and the bulk-water region beyond.
[0132] Hence, it appears that the mechanism involves radiant energy-induced splitting of bulk water into negative and positive entities. The negative entity forms the ordered EZ, while the positive entity distributes itself broadly over the bulk. The negative-positive combination forms a battery-like entity, fueled by radiant energy.
[0133] While the energy of an IR photon is generally considered too low to split water, some dissociation of water occurs even in the absence of external energy sources; i.e., the dissociation constant of water, Kw=[H+][OH—], underlies all pH measurement, and presumes that there is some dissociation even under ambient conditions. Incident IR would merely augment the naturally occurring dissociation. Once dissociated—either under natural IR exposure or augmented IR—the negative component would then go on to form the more ordered EZ. IR-induced ordering of water is not a new result; such ordering has been reported previously. Hence, there is precedent for this kind of IR-induced ordering.
[0134] Classical thermodynamics prohibits splitting of water by IR because the energy required to break a partially covalent hydrogen bond is greater than energy of an IR photon. On the other hand, quantum considerations suggest that infrared radiation, between 3 µm and 14 µm, has strong resonant effects on OH stretch, thereby resonantly raising the system's vibrational energy. Of those wavelengths, 3.1 µm, or wavenumber approximately 3200 µcm<-1>, corresponds to the symmetric OH stretching of tetrahedrally coordinated, i.e., strongly hydrogen-bonded, “ice-like” water; hence, interfacial water has a more localized peak at 3200 cm<-1 >than does bulk water. Further, incident IR results in experimentally confirmed frequency-selective resonant photo-dissociation of the hydrogen-bond network. Apparently, such resonant irradiation induces multiphoton excitation of water molecules, which reorganizes the large hydrogen-bonded network into smaller ion-pair-state (H+ . . . OH—) water clusters with increased mobility. Thus, the IR-induced dissociation of water implied here has both precedent and physical rationale.
Example 2
Experimental Methods
[0135] The experimental chamber was made of a 2-mm thick rectangular plastic block with a vertically oriented 1-cm diameter cylindrical hole cut in the middle. The bottom of the hole was sealed with a No. 1 glass microscope cover slip (150 µm thick), through which the sample could be observed. Prior to each experiment all surfaces were cleaned thoroughly with ethanol and de-ionized water.
[0136] The suspensions under study consisted of three components: a single ion-exchange-resin bead (Bio-Rex MSZ 501(D) resin), microspheres, and distilled, de-ionized water. The ion-exchange-resin beads used were 600±100 µm in diameter and came in two types: anionic and cationic. Only one bead was used in each experiment, either positively charged or negatively charged. Prior to use, beads were washed with ethanol, and then washed again several times with de-ionized water from a Barnstead D3750 Nanopure Diamond purification system (type I HPLC grade (18.2 MO) 2 µm, polished).
[0137] The microspheres used in this study were principally surfactant-free sulfate, white, polystyrene-latex, 2 µm in diameter (product number 1-2000, Interfacial Dynamics Corporation, Portland, Oreg.). Particles of this size undergo vigorous Brownian motion in water, and are sufficiently large to be imaged with a conventional light microscope. The microspheres are synthesized with a large number of sulfate groups chemically bound to their surfaces. These groups dissociate in water, each having a single negative charge bound to the microsphere surface and giving a compensating positively charged counter ion in solution. Therefore, the sulfate microspheres used in experiments were negatively charged.
[0138] All experiments were conducted on a Melles Griot isolation bench to shield against ambient vibration.
[0139] We pursued three categories of experiment: (i) one positively charged bead and negatively charged microspheres; (ii) one negatively charged bead and negatively charged microspheres; (iii) controls. For each experiment, a single bead was first placed in the chamber. Then, an aqueous microsphere suspension with a volume fraction of approximately 0.08 was added. Once the bead settled firmly to the bottom, the chamber was sealed carefully with a No. 1 microscope cover slip and put on the sample stage of an inverted Zeiss Axiovert-35 optical microscope, used in the bright-field mode with either a 10×, 5×, or 2.5× objective lens depending on the goal of the particular experiment. An attached color digital camera (Scion Corporation, CFW-1310C) was used to record images and videos. Track* Version 1.0 (© 2001 Penn State University) was used to track the trajectories and coordinates of the microspheres. Radial velocity was then calculated as a function of distance from the bead surface, and the results were plotted.
[0140] In the controls, different negatively charged microspheres (2 µm carboxylate, Polysciences, Inc. Cat #18327) were used to test if the attraction might be the consequence of the specific surface-functional group that was ordinarily used. As another control, we replaced the ion-exchange bead with another charged surface, Nafion, to test whether unanticipated ion-exchange action might have caused the attraction. Nafion-117 is composed of a carbon-fluorine backbone with perfluoro side chains containing sulfonic acid groups, fabricated from a copolymer of tetrafluoroethylene and perfluorinated monomers. A 600-µm diameter Nafion grain was used in place of the bead. Third, extremely diluted concentrations of microspheres were used to determine whether the long-range attraction still exists when microsphere-microsphere distance increases sufficiently. We employed the lowest practical concentration (1/200 normal)—one that just barely allowed the required measurements to be made. Finally, some of the experiments were repeated in a chamber made solely from polycarbonate to rule out artifacts due to glass surfaces at top and bottom.
Results
Positively Charged Bead and Negatively Charged Microspheres
[0141] For these experiments, one positively charged bead was placed in a solution of negatively charged microspheres (see FIG. 10). Immediately after the chamber was placed on the microscope stage, microspheres were observed to be moving toward the bead surface from all directions. These movements continued for up to three hours. The motion occurred throughout the chamber towards the bead from all directions, as illustrated by the arrows in FIG. 10. At distances of 200 µm from the bead surface, microspheres moved consistently toward the bead at a speed of about 1 µm/s.
[0142] Attractive movements were found even at distances of up to 2 mm from the bead surface (FIG. 11). Data points obtained from four orthogonal directions were assembled into a single figure for comparison. All data were recorded just after the microsphere suspension had been added to the chamber. The resulting velocity-vs.-distance trends are similar in all four curves. At distances farther than 400 µm from the bead surface, velocity remained invariant at a value of ~0.3 µm/s. At positions closer than ~200 µm, velocity began to noticeably increase approximately exponentially, up to a value of ~5 µm/s at the bead surface, implying a distance-dependent attractive force. On the other hand, the fact that microspheres still moved toward the bead at distances of 2,000 µm or farther implies that attractive interactions extend over an extremely long range.
[0143] With increasing time, microspheres accumulated progressively at the surface of the bead, and after one hour, a bead-surface cluster could be readily detected (FIGS. 12A-12C). FIG. 12A is the image of the bead surface at the start of the experiment. In FIG. 12B, taken after one hour, the bead surface appears darker because more microspheres had deposited. In order to examine more details of microsphere deposition on the bead surface, smaller microspheres (D: 0.47 µm) were substituted for the 2-µm spheres ordinarily used. The surface structure could then be seen as a colloidal crystal (see FIG. 12C). Possibly, an element of crystallinity was present with the larger microspheres as well, but less conspicuous because of irregularities in layered structure and the presence of fewer layers.
[0144] Microsphere movements were tracked in several different focal planes, above, below, or the same as, the bead's equatorial plane. Irrespective of the plane, microspheres behaved similarly—moving toward the bead and moving faster when within 200 µm of the bead surface. Eventually, all microspheres settled on the bead surface.
Negatively Charged Bead and Negatively Charged Microspheres
[0145] For these experiments one negatively charged bead was used in conjunction with negatively charged microspheres. In contrast to the former setup with the positively charged bead, the negatively charged bead was ultimately surrounded by a clear “exclusion zone” devoid of microspheres (FIG. 13). Such exclusion zones have been reported in detail in earlier work. The exclusion zone first grew with time, and finally became stable after approximately 10 minutes. It extended roughly 300 µm from the bead surface, similar to previous observations.
[0146] During the formation of the exclusion zone, microspheres were progressively excluded from the vicinity of the bead, translocating to positions beyond the exclusion zone. Once the exclusion zone was fully established, microspheres became attracted to its far edge from all directions, as illustrated by the arrows in FIG. 13. Such attraction is unexpected, as microspheres and bead have the same (negative) charge polarity.
[0147] The dependence of velocity on distance from the exclusion-zone edge is shown in FIG. 14. Positive values of velocity imply attraction between negatively charged microspheres and negatively charged bead surface. The figure confirms that microspheres were attracted towards the bead from every direction, and from distances as large as 2 mm from the edge of the exclusion zone. The velocities were lower than in the case with positively charged bead, and remained at more or less the same value of -0.3 µm/s throughout the effective range of up to 2 mm from the exclusion-zone edge (with some diminution close to the exclusion-zone edge; see Discussion), indicating the presence of a long-range attractive force in the direction of the bead, even though the bead and microspheres are of the same charge polarity.
[0148] Upon examining different focus planes, we found that as microspheres moved closer to the bead, they also moved toward the lower focal plane. Most of them accumulated on the glass surface at the bottom of the chamber, near the point where the bead touched the floor of the chamber. Immediately above the chamber floor and near to the bead, some microspheres translated away from the bead as others from above moved toward the bead, as though there were some minor circulation within a zone of about 150 µm. For the most part, however, microspheres progressively accumulated at the bottom, near the bead.
[0149] The pictorial time course of accumulation is shown in FIG. 15 with a negatively charged bead sitting at the bottom of the chamber. The pictures were taken at a focal plane lower than bead's equatorial plane. The region of sediment around the bottom of the bead grew with time, as can be seen by the progressive growth of the white area. Furthermore, after 24 hours, the suspension itself appeared much clearer, indicating fewer microspheres remaining in suspension—most of them having already settled at the bottom near the negatively charged bead.
Controls
[0150] We substituted carboxylate microspheres in order to rule out the possibility that the attraction was related to some specific feature of the sulfate microspheres used regularly. The results were similar. The negatively charged carboxylate microspheres were attracted to the negatively charged bead in all planes out to a distance of more than 2 mm from the exclusion-zone edge. Likewise, attraction to the positively charged bead took place at a velocity of 0.3 µm/s when microspheres were farther than 400 µm from the bead surface; and, beginning at a distance of ~200 µm from the bead surface velocity increased exponentially to a terminal value of 4 µm per second at the bead surface. Hence, in terms of the long-range attraction to both positively and negatively charged beads, carboxylate microspheres behaved in the same way as sulfate microspheres.
[0151] We also checked the bead. In order to test for some unanticipated ion-exchange effect of the particular bead material, we substituted a grain of Nafion. Similar to the negatively charged bead, the grain of Nafion also developed an exclusion zone, which grew to 300 µm within 20 min. Measured just after that time, microspheres translated towards the edge of the exclusion zone at a velocity of ~0.3 µm/s, quantitatively similar to the behavior observed with the negatively charged bead. Hence, the nature of the “attractor” material seemed to play no decisive role.
[0152] Experiments were also carried out using a reduced concentration of microspheres to see whether long-range attraction still exists when the separation of microspheres is very much increased. At the lowest practical concentration (1/200 normal), the mean distance between adjacent microspheres was ~200 µm. Surprisingly, long-range attractive behavior persisted. FIGS. 16A and 16B show representative curves of distance vs. velocity respectively around positively and negatively charged beads with reduced microsphere concentration. Positive values of velocity indicate attraction. In both cases, microspheres move toward the bead throughout the 2-mm range. The shapes of these curves are similar to those in FIGS. 11 and 13, respectively, although the velocities are lower and there is considerable scatter. Despite such extreme distances between microspheres, long-range attraction was still evident.
Example 3
Methods
[0153] A length of 3-mm diameter Nafion tubing (PermaPure TT-110, Toms River N.J.) ~7 cm long was placed in a plastic chamber 4.5 cm wide, 1.8 cm long, and 6.4 mm deep. The tube laid horizontally in the reservoir, protruding through each of two holes drilled in opposite sides of the chamber wall. Hole diameter was carefully chosen to hold the tube securely but not allow water to escape.
[0154] A solution of distilled, deionized water (resistivity of 18.2 MO-cm, Barnstead Accu-Dispense) and 2 µm carboxylate microspheres (Polysciences Inc, Warrington Pa.) was prepared using a ratio of 1 drop of microsphere suspension per 15 mL of water. The resulting suspension was mixed until it appeared homogeneous. The Nafion tube was placed into the empty reservoir, with ends protruding through the holes. The solution was then poured to fill the reservoir to a level 1.3 mm above the tube, and a syringe was used to fill the inside of the tube, whose ends were both left open to the air. Both the reservoir and tube were filled from the same microsphere suspension. The reservoir/Nafion-tube system was then set aside for 10-15 minutes to allow the EZ to develop.
[0155] For puncturing the tube, a tapered needle was made using a 5-mL, 1.1-mm outer-diameter glass pipette (VWR, West Chester Pa.) and a vertical pipette puller (David Kopf Instruments, Tujunga Calif.). This device heats the glass while pulling apart both ends, resulting in two very fine tapered glass needles ( ~0.05 mm diameter at the tip). One of these needles was placed in a micro-manipulator that allowed for fine motion along all axes, and which facilitated the hole puncturing.
[0156] After the tube had been immersed in the suspension for 10-15 minutes, a hole was created midway along the length of tube by pushing the needle through the side of the tube wall until it created a hole ~0.2 mm in diameter. The needle was then slowly retracted, taking care to avoid disturbing the Nafion tube unduly, and leaving the hole open for water to pass through.
[0157] Water flow was observed by tracking the suspended microspheres under an inverted microscope (Nikon Diaphot, with Zeiss CP-Achromat magnifier and Leica DFL-290 camera) with 5× objective. We confirmed that liquid was indeed flowing into the tube by observing the continuous movement of the meniscus inside the tube. As the suspension had a relatively uniform microsphere density, the number of microspheres seen passing through the hole from the reservoir into the tube should be directly proportional to the flow volume, which would otherwise be difficult to measure accurately.
Results
[0158] The initial result was the visual observation of a clear and consistent flow of water from the outside of the tube, through the hole, to the inside of the tube. This is shown in FIGS. 16A and 16B. The figures shown are representative of ten experiments each carried out identically as described above.
[0159] By tracking the inward motion of microspheres through the hole, it was possible to monitor the rate of flow over time. Inward flow started out strong but dropped off to a constant non-zero value after tens of minutes (see FIG. 17). The plateau values varied from experiment to experiment, depending mainly on hole diameter; but mean values obtained from ten experiments were 5.7+/-2.7 microspheres per second.
[0160] To test the possibility that only the microspheres, but not the microsphere suspension, were passing through the hole, we examined the menisci position inside the tube as a function of time. There was a clear shift in the menisci at both ends of the tube starting immediately after the hole was opened, indicating that the fluid was indeed flowing through the hole rather than the microspheres alone. Additionally, the shape of the menisci changed from concave initially to flat while fluid was flowing; this implied that it was indeed the fluid's pressure that was pushing the menisci outward.
[0161] To test whether the underlying mechanism involved local effects only, we created a second hole ~1 cm from the first. This was done approximately one hour after the first hole was punched. We found that the flows were coupled; i.e., just as the second hole was punched, flow through the first hole abruptly diminished (FIG. 18). Meanwhile, flow through the second hole exceeded the pre-puncture flow through the first hole. Both flows continued to decrease with time. This coupling implied that the flow was dependent both on local properties and characteristics of the tube system in general.
[0162] To determine whether EZ size might play a role in determining flow, we tracked inner and outer EZ sizes as a function of time, along with flow rate (FIGS. 19A and 19B). Outer EZ showed little variation with time; however, inner EZ did vary substantially over time: as inner EZ size shrank, flow diminished concomitantly. Representative data are shown in FIGS. 19A and 19B.
[0163] To test further for EZ involvement in the phenomenon, a control experiment was carried out using a Tygon tube (Cole-Parmer, Vernon Hills Ill.) which exhibits no EZ. The same procedures were followed as described above, using a tube of similar size and diameter. The needle produced a hole in the tube, but no flow was observed. From these observations and those of FIG. 19A and FIG. 19B we could draw two conclusions: First, the exclusion zone is likely to be a relevant factor for the presence of flow. And second, that gravity-related hydrostatic pressure is not a critical factor, as the depth of the silicon tube was the same as the Nafion tube.
[0164] In order to explore further the role of the EZ in this flow, we studied whether flow dynamics might be impacted by induced changes in EZ size. Earlier research had shown the EZ to be negatively charged. Hence, by adding H<+> in the form of an acid, charge neutralization could reduce EZ size; or, by adding OH<-> in a base the increased negative charge could enhance EZ size. This expectation proved accurate, and it was thus possible to test the effects of EZ size on flow rate. These tests involved creating acidic or basic suspensions, which were then substituted for the aqueous suspensions inside or outside the tube, giving four different conditions.
[0165] With a 0.01M NaOH-containing microsphere suspension introduced into the Nafion tube instead of the control suspension, the inside EZ expanded from ~0.2 to ~0.5 mm. When punctured, the inward flow was considerably greater than the control. Instead of dropping to a rate of 4-5 microspheres/second, the flow leveled off at 20-25 microspheres/second (FIG. 17). Hence, increased inside EZ was associated with increased flow.
[0166] With HCl of the same concentration inside the tube, the inside EZ became almost zero, compared to ~0.2 mm for the control. The flow began inward as usual, then dropped to zero at the 5 minute mark, and then reversed direction. The outward flow increased over the next half hour, reaching a maximum outward flow rate of 10 microspheres/sec before diminishing to a slower rate (FIG. 21). Similar patterns were seen in each of six experiments, although the dynamics differed slightly.
[0167] Acidic and basic solutions were also placed outside of the tube rather than inside. With acid outside the tube, the flow behaved similarly to the NaOH-inside results: inward flow was much higher than the control and remained at a higher steady rate relative to controls after 30-40 minutes. Significant complications were encountered when using NaOH outside the tube. Once the inward flow started, the microspheres began clumping together and precipitating out of the suspension. As a result, no significant data were obtainable for NaOH outside the tube.
[0168] For all of these four pH tests, we also tracked inside EZ size, as done with the original tests described above. Inside EZ consistently decreased with time, as with controls. From these observations we began formulating a hypothesis that could account for all of these results and observations, which we discuss below.
Discussion
[0169] An unexpected flow pattern was explored in these experiments, apparently related to the presence of a so-called exclusion zone. When a Nafion tube was immersed in water and a hole was punched in the tube wall, the water flowed continuously from the outside to the inside of the tube. Although the flow rate diminished with time, it reached a plateau that persisted for at least the full period of observation, which typically exceeded one hour. Hence, the flow was persistent. And, it was observable in every one of the approximately 40 experiments carried out.
[0170] Control experiments demonstrated that the flow was not the result of some kind of hydrostatic pressure differential, but was specific to some feature of the Nafion tubing. When silicon tubing of the same dimension was substituted, no flow was seen. One prominent feature of Nafion is the presence of large exclusion zones, or EZs adjacent to its surface (Zheng and Pollack, 2003; Zheng et al., 2006). Silicon tubing is hydrophobic, and shows no such zones. Hence, it appeared that some feature of Nafion's EZ-generating capacity of the Nafion might be responsible for inducing this flow.
[0171] We confirmed that flow rate depended on the size of the annular EZ inside the tubing. Increasing EZ size by adding base within the tubing increased flow magnitude, while diminishing inside EZ size by adding acid inside diminished the flow. We also found that dynamic changes of EZ size correlated with dynamic changes of flow. Hence, the evidence implied that some aspect of inside-EZ size might be responsible for driving the flow.
[0172] The driving mechanism may involve charge separation. The EZ is negatively charged, while the region beyond is positively charged as a result of proton release. The protons would be expected to combine immediately with water, creating hydronium ions, i.e., positively charged water. Hence, a possibility to explain the flow is that the positively charged water molecules are attracted by the negative potential of the inside exclusion zone. Once the tube is punctured, the positively charged water directly adjacent to the puncture will be strongly drawn toward the interior negativity. The farther-away molecules outside the tube are then drawn to the space previously held by the original molecules. Moving closer, these molecules will in turn feel the strong pull of the interior negativity, and will be drawn with equal vigor into the tube. Thus, the flow persists.
[0173] Additional mechanisms would contribute to the temporal decline in flow rate. The influx of protons into the tube effectively neutralizes the negatively charged EZ, diminishing internal EZ size. The decrease in EZ size in turn decreases the electrodynamic force exerted on the water molecules, which in turn leads to a lower flow rate. This negative feedback cycle would lead to exponential flow patterns similar to those described above.
[0174] While this mechanism seems consistent with observations, additional experiments will be required to test its detailed features and predictions. The main purpose here is to report this unexpected but consistent flow, and to speculate on the possible driving force. Other driving mechanisms may be possible, but the consistent correlation between EZ size and flow rate makes the present one attractive at least as a starting point.
[0175] Implicit in this persisting flow is some source of persisting driving energy, for baseline flow persists without apparent diminution for extended lengths of time, well beyond one hour. If it is the mechanism above that bears responsibility, then a likely source of energy is incident radiant energy, for EZ buildup is fueled by radiant energy, particularly in the infrared region. Hence, infrared energy might be the ultimate driving source for this persisting and counter-intuitive flow.
METHOD
AND APPARATUS FOR COLLECTING FRACTIONS OF MIXTURES,
SUSPENSIONS, AND SOLUTIONS OF NON-POLAR LIQUIDS
US2011036780
US2011036780
A polar liquid mixture containing suspended or dissolved particles or solute is exposed to air or a hydrophilic surface. An exclusion zone having a reduced concentration of particles or solute is formed in the polar liquid adjacent to the interface with air or the hydrophilic surface. One or more fractions of purified polar liquid and/or concentrated particles or solute are collected. A sensor can provide feedback to the collector.
SUMMARY
[0002] Systems and methods are described for separating and/or collecting fractions of fluids including components of mixtures, suspensions, and solutions in polar liquids. In one embodiment, an apparatus flows an aqueous mixture over a hydrophilic surface to form a first region of purified water and a second region of at least one concentrated non-aqueous component. The apparatus can draw off either the purified water or the concentrated non-aqueous components. In one embodiment, an array of tubules performs the differential extraction. In another embodiment, various hydrophilic and/or hydrophobic surfaces are disposed in multiple differential extractors and some effluents may be recycled to perform complex assaying and separation. In another embodiment an apparatus can draw off purified water just beneath an air-water interface.
[0003] According to an embodiment, an apparatus for collecting a fraction of a mixture, suspension, or solution of a polar liquid includes a first collector configured to collect a fraction of a mixture, suspension, or solution of a polar liquid at a selected distance at or away from an interface between the polar liquid and air or a hydrophilic surface; and a structure configured to hold the first collector at the selected distance. A first fraction collected from a first region at a first proximate distance at or away from the interface includes substantially pure polar liquid. A second fraction collected at a second distal distance away from the interface in the second region includes a an increased concentration of a solute or particle component compared to the first fraction.
[0004] According to another embodiment, a method for collecting a fraction of a polar liquid mixture, suspension, or solution includes receiving, establishing, or accessing a volume of a polar liquid mixture, suspension, or solution; allowing an exclusion zone to form adjacent to an interface between the polar liquid mixture, suspension, or solution and air or a hydrophilic surface; and collecting a fraction of the polar liquid mixture, suspension, or solution at or at a selected distance from the air or hydrophilic surface.
BRIEF DESCRIPTION OF THE DRAWINGS
[0005] FIG. 1 is a diagram of an exemplary differential extractor for separating components of aqueous mixtures, according to an embodiment.
[0006] FIG. 2 is a diagram of exemplary dimensions of one implementation of the differential extractor of FIG. 1, according to an embodiment.
[0007] FIG. 3 is a diagram of an exemplary system for separating components of aqueous mixtures, according to an embodiment.
[0008] FIG. 4 is a diagram of concentration gradients achieved by an exemplary system, according to an embodiment.
[0009] FIG. 5 is a diagram of swelling of an exemplary material used in a differential extractor, according to an embodiment.
[0010] FIG. 6 is a diagram of exemplary solute exclusion, according to an embodiment.
[0011] FIG. 7 is a diagram of growth of an exemplary exclusion zone over time, according to an embodiment.
[0012] FIG. 8 is a diagram of exemplary separation of a protein from an aqueous mixture, according to an embodiment.
[0013] FIG. 9 is a diagram of exemplary separation of a dye from an aqueous mixture, according to an embodiment.
[0014] FIG. 10 is a diagram of an exemplary interface between a gel exclusion surface and a collector, according to an embodiment.
[0015] FIG. 11 is a diagram of an exemplary exclusion zone over time and at different distances along an exclusion surface, according to an embodiment.
[0016] FIG. 12 is a diagram of an exemplary extraction apparatus to interface with a gel exclusion channel, according to an embodiment.
[0017] FIG. 13 is a diagram of an exemplary array of differential extractors, according to an embodiment.
[0018] FIG. 14 is a flow diagram of an exemplary method of separating components of aqueous mixtures, according to an embodiment.
[0019] FIG. 15 is diagram of an exemplary exclusion zone just beneath an air-water interface, according to an embodiment.
[0020] FIG. 16 is a diagram illustrating principal features of an apparatus for collecting a fraction of a mixture, suspension, or solution of a polar liquid, according to an embodiment.


DETAILED DESCRIPTION
Overview
[0021] Embodiments according to this disclosure describe methods and apparatuses for collecting fractions of mixtures, suspensions, and solutions of polar liquids. For example, the polar liquid can consist essentially of water. Other polar liquids that form an exclusion zone adjacent to an interface with a hydrophilic surface or air may behave similarly and have fractions of mixtures, suspensions, or solutions collected.
[0022] Illustrative examples relating to the collection of fractions from water are described as embodiments herein, but similar apparatuses and methods may be made and performed using similar approaches with other polar fluids. The term “aqueous mixture” will be used herein to represent an illustrative aqueous mixture, suspension, or solution. To collect fractions, the aqueous mixture is exposed to a hydrophilic surface, such as the inside of tubes made of hydrophilic materials. A region corresponding to a “purified water” fraction forms near the hydrophilic surface in which one or more solutes or other non-aqueous components are partially or entirely excluded. Hence, the hydrophilic surface is also referred to herein as an “exclusion surface.” Likewise, a region corresponding to a “concentrated solute” fraction forms “away from” the exclusion surface. Thus, the gradient caused by the exclusion surface can be exploited to obtain fractions of water such as purified water or a concentrated phase of a non-aqueous component.
[0023] Such aqueous mixtures include salt solutions, colloids, suspensions, waste water, bodily fluids, mining tailings, etc., that is, most any combination of water and another compound or substance. Non-aqueous components of an aqueous mixture can include organic and inorganic salts, biomatter, pathogens, bacteria etc., and many other solids and semi-solids. For example, the exemplary techniques to be described herein can separate microspheres that are similar in size to bacteria to easily obtain a 20:1 separation.
[0024] In one implementation, an exemplary method removes salts from water to obtain efficient desalination. The salts to be separated can include sodium chloride, seawater salts, components of buffer solutions, and many other salts and ionic compounds. Hence, exemplary methods can separate ionic (charged) components from water mixtures, or can separate neutral, non-ionic species from water mixtures too.
[0025] From another perspective, the subject matter to be described can concentrate dissolved or suspended species from aqueous solutions. That is, instead of pure water being the only desired product, an exemplary method can be used to concentrate the non-aqueous components of an aqueous mixture. This can be useful in many manufacturing processes and in the clinical lab, e.g., for diagnosing medical conditions via blood work and other physiological tests that involve bodily or cellular fluids. The exemplary methods described herein can be used to separate and/or concentrate salts, pathogens, contaminants, dyes, organic and inorganic species, etc., from aqueous mixtures. Solute size can be as small as a few nanometers (e.g., molecular weight of approximately 300).
[0026] In one implementation, multiple separation stages are performed in series, including, for example, a cascade of multiple similar stages iterated to amplify the effect, as well as variegated stages for different materials. Thus, process flow may follow a tree structure or flow diagram analogous to complex stages of a chemical synthesis or purification, in which different components are separated or concentrated at different times and in different quantities by different implementations or instances of the exemplary exclusion surface. The succession of stages allows an exemplary process to exclude more types of solutes from an increasingly purer aqueous mixture. The succession can also improve the purification of a single material, e.g., to automatically obtain a super pure product in the lab. Moreover, a user can specify which non-aqueous species are to be separated out or concentrated from an aqueous mixture.
Exemplary Process
[0027] We found that many solutes were excluded from a region adjacent to hydrophilic surfaces. Included among the excluded species were microspheres of various size, erythrocytes, proteins, and even small molecular weight dyes. Salts also appeared to be excluded. The exclusion zone varied in size, but in one implementation was several hundred micrometers wide. Given the large size of this zone, and the exclusion of many solutes, we discovered that the exclusion zone contained “pure” water, which could then be harvested. The formation of the exclusion zone was similar to the formation of ice—which crystallizes to the exclusion of foreign materials in its molecular structure.
[0028] In general, negatively charged surfaces exclude negatively charged solutes, and positively charged surfaces exclude positively charged solutes. So, for many different solutes, a surface can be selected that will exclude solutes from a region of pure or purer water. Bacteria, viruses, etc., fall into size and charge domains as solutes that we typically tested, so these too can be excluded from the region of purified water. Biological specimens, such as red blood cells, were also excluded from this region. It is worth noting that negatively charged surfaces do, in general, exclude negatively charged solutes; however, some positively charged solutes are excluded as well. Similarly, positively charged surfaces generally exclude positively charged solutes, but also some negatively charged solutes as well.
[0000] Flow Profile measurements
[0029] An initial issue to be tested was whether the water in such an exclusion zone near a surface was or was not bound to the nucleating surface (i.e., a gel, polymer, or other exclusion surface). If the water adhered tightly, then removal would not be easily possible. To pursue this question we used polyacrylic acid gels, with characteristic dimensions of several centimeters, containing a 2-mm channel. Because the gel was clear, the channel could be visualized using an optical microscope. Microsphere suspensions were forced through the channel under pressure. At the entryway, microspheres were uniformly distributed across the cross section. Farther along the channel, an exclusion zone developed: the annulus was clear, while the core region contained concentrated spheres. Still farther along, the clear annulus grew at the expense of the core, and ultimately, after several centimeters, the relative dimensions of annulus and core no longer changed.
[0030] To assess whether annular water adhered to the gel surface, we measured volume flow at intervals of several millimeters along the channel. The profile could be measured only in the core, where microspheres were present, and not in the annulus, where there were no markers. Thus, the complete profile could be measured near the entryway, while only partial profiles could be measured farther along. Each profile was integrated to give volume flow. Thus, we could obtain volume flows in the microsphere-containing zones at intervals along the channel. If the integrated flows were equal at all points, then we would have concluded that the annular regions were adherent; only the microsphere-containing regions flowed. By contrast, we found that the integrated profiles diminished significantly with distance along the channel. This meant that volume flow in the microsphere zones decreased progressively along the channel. Or, in other words, some of the flow had to come from the clear annulus. We established that the annular region did, indeed, flow (at least in part), making possible the exemplary techniques.
Apparatus for Solute Separation
[0031] As shown in FIG. 1, an exemplary “differential extractor” 100 separates a solution into concentrated and dilute (clear) fractions. The principle of the extraction is also illustrated in FIG. 1. A homogenous microsphere suspension 102 enters a NAFION tube 104 at one end (DuPont Corporation, Wilmington, Del.). NAFION is a Teflon-like polymer with exposed sulfonate groups, used in fuel cells, actuators, and other applications. In one implementation, NAFION was found to be an ideal exclusion surface and will be referred to herein as a representative material for the exemplary exclusion surface, although other materials can also be used for the exclusion surface. As the solution travels through the NAFION tube 104, the microspheres 102 migrate from the walls 106 of the tube 104 and gather in the core region 108. Clear water from the exclusion zone 110 and microsphere-containing water 112 pass through different channels of the extractor 100, and are then collected. In one implementation, the differential extractor 100 is used to extract clear water.
[0032] In FIG. 2, the dimensions of one implementation of the exemplary differential extractor 100 are given. An elevation view 202 shows the two different channels that draw off the concentrated and diluted products of the separation. Of course, either the concentrated or diluted products of the extractor 100 can be subjected to subsequent instances of the extractor 100 to provide further concentration or dilution of the particular product. The concentration branch or the dilution branch of the extractor 100 can even be looped back to the input of the NAFION tube to recycle the particular product multiple times through the same extractor 100.
[0033] Another implementation of an extraction schema is shown in FIG. 3. Pump “1” 302 and Pump “2” 304 reduce the pressure in the peripheral channel and the center channel, respectively, to facilitate collection. Pressure reduction in the channels results in inflow of solution into the channels with linear velocity proportional to the negative pressure generated by each pump. The negative pressures can be adjusted so that the linear velocity is equal in both channels. The concentrated and dilute solutions can be collected in different syringes. Importantly, in this implementation, the tube 104 itself can be immersed in the, e.g., microsphere 102 (or salt) solution. Hence, the initial concentration in the solution outside the tube 104 is the same as that of the solution inside.
[0034] Three differential extractors 100 are described as examples. In one implementation, the extractor 100 is constructed with glue. Brass bushings are used for maintaining tube concentricity. The proximal end of the extractor 100 is initially flush. This implementation shows that the exemplary extractor 100 can be made of diverse materials, as long as they are impervious to the components being separated.
[0035] In another implementation, the extractor 100 can be constructed from stainless steel tubing, and overall lengths can be increased to accommodate some different features. In this case, the extractor 100 incorporates an extension sleeve on the outer tubing to increase extraction efficiency.
[0036] In yet another implementation, the differential extractor 100 has larger diameter stainless steel tubing to accommodate a relatively larger NAFION tubing 104 that, especially effective for some applications. For example, construction can be carried out with low temperature silver solder, and concentricity can be maintained by dimpling the outer tube. The distance between inner and outer tube, the annulus, can be approximately 0.1 mm. Also, the central tube, used to collect highly concentrated microspheres, can be extended out 0.5 mm at the proximal end. This makes it possible to visualize the extraction process microscopically. This, in turn, may allow flows to be regulated in a sensitive manner to match the relative size of the exclusion zones. In one implementation, the smaller the exclusion zone 110, the larger should be the difference of flow in order to achieve good separation. Given the availability of a sensitive manner of adjusting flows, 10-20 times concentration difference can be obtained (e.g., see images in FIG. 1).
[0037] The particular geometry and materials employed in the exemplary extractor 100 can be varied to improve results for a particular application. For instance, a polyacrylic-acid gel may also be used as the exclusion surface.
[0038] In one implementation, particles in the micron-size range can be separated out of water using the exemplary techniques. Depending on refinement of the implementation, the extractor 100 may achieve a 10:1 or 20:1 concentration difference ratio between purified water and microsphere enriched output. With multiple extraction stages in series, e.g., using different extraction surfaces, superb separation ratios are achievable. Separating (micron-sized) pathogens is therefore possible.
Spectrophotometric Studies
[0039] In one implementation, relatively slow flow in the NAFION tube is maintained in order to prevent turbulence, which increases reliability and may be used in circumstances in which the speed of extraction is of secondary importance. For example, in a model implementation, 100 ml of concentrated and 10 ml of dilute solution were collected over 10-12 hours.
[0040] An exemplary method was adopted to detect even small differences in concentration. We found that spectrophotometer readings gave the first sign of successful separation, albeit sometimes they were very small. After two fractions were collected, absorption spectra were obtained for concentrated and dilute species using a UV-VIS spectrometer. Examples of absorption curves are shown in FIG. 4, where the upper curve corresponds to the concentrated fraction and the lower curve corresponds to the purified fraction. The result corresponds to one implementation, in which the separation ratio was relatively low, approximately 1:2 or 1:3. Early development of the separation principle also showed that the spectrophotometric method could be used as a sensitive detector of even subtle differences between fractions.
Microsphere Counting
[0041] After the spectrophotometric approach for detecting a concentration gradient was pursued, an initial gel implementation was replaced by the NAFION tubing described above, and improved extractors were thereby developed. As development of exemplary methods progressed, the concentration difference between fractions grew sufficiently large, up to 20:1, that it could be seen by the naked eye, or measured accurately by use of a microscope.
[0042] Thin layers of the concentrated and dilute fractions were therefore created and viewed with a microscope. Since the microscope has a finite depth of field, direct counting of microspheres in the field gives the number within some fixed volume, i.e., the concentration. By comparing the number of the microspheres in the respective fractions, the concentration difference could be ascertained. In one phase of development, approximately ten experiments were carried out. The layers of solution were of the same thickness, ca. 0.1 mm. The area was 1-2 square cm.
[0043] One result obtained using this approach showed a separation of between approximately 10:1 to 20:1. However, in this implementation the ratio was strongly dependent on the desired collection rate. If water from the outer annulus was drawn very slowly, we estimate that, practically, it will be possible to obtain separation coefficients of 100:1 or even higher—mainly because the exclusion zone never contains microspheres, even when the microsphere concentration is raised to high values.
Further Experimental Details
[0044] Initial microsphere concentration was 2.84×10 exp6 particles/ml in most experiments during development. In the photographs presented, the initial solution concentration was 1.13×10 exp7 particles/ml. POLYBEAD Carboxylate 2.0 µm microspheres were used and were diluted in distilled water (Polysciences, Inc., Warrington, Pa.).
[0045] The extraction speed, i.e., the volume flow inside the NAFION tube, was 1 ml/hour if the experiment was conducted overnight or 4-5 ml/hour during the daytime. With this speed, we collected 2 ml of dilute solution per 10 ml of concentrated solution; generally this took 2.5 hours.
[0000] Salt Separation & Small Osmolality Difference Measured with the Osmometer
[0046] After experiments with the microspheres were carried out, we began experiments with salt solutions (e.g., sodium chloride, ~500 mmol/l). Initially, these experiments were carried out the same way as with the microspheres solution. The experimental setup was similar or the same, although a microscope was not used for adjusting the flow velocity because no microsphere markers were present. Of seven example experiments conducted, four showed osmolality difference between “concentrated” and “dilute” fractions. Experimental results for these are shown in the Table (1) below.
[0000]
TABLE (1)
[mathematical formula]
No of Experiment No of Measurements “Diluted” Solution Concentration, mmol/l (Dc) “Concentrated” Solution Concentration, mmol/l (Cc) Cc - Dc Cc - Dc Dc ? 100 ? % Average %
1 1 466 499 33 7.08% 7.53%
2 467 505 38 8.14%
3 475 510 35 7.37%
2 1 673 733 60 8.92% 7.81%
2 687 733 46 6.70%
3 690 744 54 7.83%
3 1 630 651 21 3.33% 3.10%
2 632 651 19 3.01%
3 644 663 19 2.95%
4 1 964 1001 37 3.84% 5.23%
2 984 1032 48 4.88%
3 1005 1075 70 6.97%
[0047] The repeatability of the salt solution separation measurements in each experiment was significantly high. In some circumstances, it may be that the exclusion zone is considerably smaller with high concentrations of salt than with microspheres in pure water; hence, the outer annulus collected some pure water and mostly salt water. A collector with smaller annulus can be built for salt exclusion.
NAFION Tube Swelling Experiments
[0048] We observed that sometimes, some grades of NAFION swell less in salt solutions than in pure water. The higher the osmolality, the less the NAFION swells. Thus, one possibility is that salt ions are held by the water molecules—they do not enter the NAFION polymer, either within the NAFION wall itself, or immediately around the wall. In other words, they may not penetrate into the exclusion zone.
[0049] We hypothesized that if salt ions do not enter in or around the polymer network, then, as the NAFION swells, the salt concentration of the solution used to swell the NAFION becomes higher. This hypothesis was tested in the following experiment. First, a salt solution of known concentration was pumped inside the dry NAFION tube. The outside of the tube was dry. After approximately 10 minutes the NAFION tube swelled, at the expense of the solution inside. Then, the remaining solution was pumped out of the NAFION tube, and its osmolality was measured. Three experiments were carried out. Each time, there was an osmolality increase following swelling (see Table (2) below). Hence, the results support the hypothesis: it appears that salt is excluded from around the NAFION polymer; only water appears to enter.
[0050] To check this result, calculations were made based on the assumption that only water molecules enter the NAFION polymer network. The NAFION tube was weighed as shown in FIG. 5, before and after swelling, and therefore the amount of water that enters was known. With this data, it can be calculated what the predicted concentration increase in the tube's lumen should be. Table (2) below shows excellent agreement, within several percent. Hence, the assumption that no salt enters in/around the NAFION polymer was tentatively validated.
[0051] Controls were made to test the possibility that the observed increase of osmolality might arise artifactually, from some chemicals diffusing out of the NAFION. This possibility was tested by swelling the NAFION in deionized water instead of salt water. The solution removed from the NAFION tube showed no measurable increase of osmolarity. Hence, the increase of osmolality in Table (2) below was considered to have arisen from salt, excluded from the NAFION network.
[0052] There may be a distinction between the water lying within, and immediately outside of, the NAFION tubing. Both are in the vicinity of polymer. If they behave similarly, then salt is deemed to be definitely absent from the exclusion zone. If not, then it is possible that the salt is excluded only from the water fraction lying within the tubing, but not from the fraction adjacent to it.
[0000]
TABLE (2)
Solution Solution Predicted concentration concentration Solution before NAFION after NAFION concentration % swelled (mM) swelled (mM) (mM) error
398 484 470 2.3
401 475 455 4.2
422 480 464 3.3
Alternate Embodiments
[0053] When experimenting with microsphere suspensions, we found that it is possible to draw small amounts of microsphere-free water from the exclusion zone. Practical success depends on how small the exclusion zone is with salt present. In the case of salt solutions, a NAFION tube can be used to create an exclusion zone. Then, a micropipette with tip diameter of, for example, 10 µm can be used to suck water via a tiny opening adjacent to the NAFION surface. By repeating this many times in a model setup, it is possible to collect solution, e.g., enough solution for osmolality measurements. Alternatively, a single step sample can be used to collect a very small amount of water. Speed of evaporation of this solution can be compared with evaporation of the solution taken farther from the NAFION surface. Practically salt-free water should evaporate more rapidly than relatively salty water.
[0054] Another measurement approach uses a sodium-sensitive electrode. These can be obtained with tips on the order of 1 mm, and even smaller tips may be available. If the exclusion zone is large enough, then the electrode should reveal the spatial distribution of concentration in the vicinity of NAFION. If necessary, the concentration of salt could be reduced to expand the exclusion zone.
[0055] In one implementation, an extractor collects water from a narrow annulus, e.g., much narrower than the 100 µm used in one implementation in the lab. This facilitates collection of water in situations in which the exclusion zone is much smaller than is the case with microspheres. A NAFION (or equivalent polymer) tube with an array of small holes may also be used, so that the relatively sodium-free water exits outside the tube rather than from an annulus within the tube.
Using Electrical Potential to Increase the Size of the Exclusion Zone
[0056] Electrical potentials may also be applied to increase the size of the exclusion zone and hence the efficacy of separation. For example, in one implementation water molecules migrate toward a negatively charged (cathode) surface. That is, the applied charge enhances the hydrophilic character of the exclusion surface, thereby increasing the region of purified water.
[0057] In another implementation, a potential difference is applied between parallel wires several cm apart in an aqueous mixture, suspension, or solution. For example, with five volts between the wires, microsphere exclusion may increase to a centimeter or more from the negative electrode. With proper choice of material for the wire(s), (e.g., similar to materials used in maintenance-free auto batteries) bubbles (electrolysis) are virtually absent.
Further Detail
[0058] One objective during development was to lay groundwork for an exemplary device that can separate salt and other solutes from water. To design such a device, we observed that solutes tend to be excluded from the zone adjacent to many hydrophilic surfaces. Solutes observed to be excluded ranged from micron-sized colloidal solutes, for example, down to small molecular weight dyes. Hydrophilic surfaces that exclude these solutes include various hydrogels and polymeric surfaces. Exclusion is seen not only in static situations but also when the aqueous suspension or solution flows in channels cut inside of gels, and this formed the basis for several implementations of the exemplary device.
[0059] In one implementation, salt water, or otherwise contaminated water, flows into the gel or polymer channel, and the salt molecules progressively migrate from the wall toward the channel axis (center of the tube).
[0060] This concentrated solution in the channel core is discarded or recycled, while the pure water in the annular region (i.e., outer region of the tube lumen) is collected. Variations of the exemplary technique were tested under a series of experimental conditions, in order to optimize purification and throughput.
[0061] In one implementation, as described above, we examined microspheres suspended in aqueous solution in the vicinity of hydrogel surfaces. The microspheres translated away from the surface, leaving a microsphere-free zone that was unexpectedly large relative to expectations of classical theory (Israelachvili, 1992): depending on conditions, the microsphere-free zone was on the order of 100 µm or more. Because the depletion of microspheres from the vicinal zone left pure water, this principle can be applied to the separation of suspended or dissolved entities, including salt.
[0062] An example of this kind of exclusion is shown in FIG. 6. The gel-water boundaries are the vertically oriented, thin, white lines. (The vertically oriented fuzzy band to the right of “gel” is an optical reflection artifact.) Microspheres migrated away from the gel surface, leaving, within minutes, a zone ~250 µm that was devoid of microspheres.
[0063] FIG. 7 shows another example of exemplary solute exclusion. In FIG. 7, the exclusion-inducing surface is again NAFION. FIG. 7 shows a time-dependent buildup of the solute exclusion zone, which typically grows in minutes to 0.5 mm or more.
[0064] Our subsequent studies have shown the exemplary exclusion methods to be generally applicable. Exemplary exclusion was observed not only in the vicinity of a series of synthetic and natural hydrogels, but also near other hydrophilic surfaces including carboxylated monolayers, PEGylated surfaces, and biological surfaces (muscle and vascular endothelium). In various implementations, excluded species include microspheres of either charge polarity, red blood cells, ion-exclusion resin beads, fluorophore-labeled protein (albumin—as shown in FIG. 8), and various low molecular weight dyes. FIG. 9, for example, shows the time course for exclusion of the fluorophore, sodium fluorescein, in the vicinity of NAFION.
[0065] In both cases in FIGS. 8 and 9, these relatively low molecular weight solutes are excluded at least qualitatively by an amount similar to the much larger colloidal microspheres. Thus, the size range of excluded species can be broad from micron-sized particles down to small molecules. All of these solutes, suspensions, etc., are excluded from vicinal water, presumably by some surface induced alteration of that water. In one implementation, we derived evidence that at least three physical features of the vicinal water are different from bulk water: NMR hydrogen nuclei relaxation times; ability to support sustained potential difference; and sharply diminished infrared radiation from the vicinal water zone.
[0066] Considering the broad size range of solutes confirmed to be excluded (12 orders of magnitude in mass), molecules beyond this range, i.e., even smaller than the lowest molecular weight dyes (e.g., mol. wt. 376) can be excluded as well.
[0067] In some experiments, we built polyacrylic acid gels (also some polyvinyl alcohol gels) containing long, cylindrical channels, as shown in FIG. 10. Solute-containing water is pumped through the channel; or, in the case of a vertically oriented channel, the suspension can flow by the force of gravity; external power is then unnecessary. At the entry, the solute is distributed uniformly over the cross-section. Farther along the channel, the solute can be progressively excluded from the zone just inside the gel. With sufficient tube length, the sub-annular region will be solute free for practical purposes, or, actually solute free given a theoretically long enough tube.
[0068] This solute-free water can then be collected using an annular channel 1002 whose outer diameter 1004 is equal to the inner diameter of the gel (FIG. 10, right side). The solute-containing water in the collection zone 1008 is in the center, i.e., inside the annular solute-free zone being collected by the annular channel 1002. When the solute-containing water is in short supply (e.g., the solute is precious), the solute-containing water can be recovered, so that the process can be repeated in cascading stages.
[0069] As shown in FIG. 11, some initial studies were carried out using 1-µm carboxylate microspheres, easily detectable with a compound microscope. Polyacrylic acid gels were molded to contain a cylindrical channel, 1.6 mm in diameter 50 mm long. Using a motor-driven syringe, suspensions of microspheres were driven through the channel. Because the gel was clear, the microspheres within the channel could be easily visualized. Clear, stable, exclusion zones increased with time (and increased faster with smaller molecular weight substances; see FIGS. 8 and 9), and grew to appreciable size at distances sufficiently far from the entry orifice. From the left, FIG. 11 shows the time course of microsphere distribution 45 mm from entry point at various times after exposure to suspension. The gel boundary is the dark region at top. At this low magnification, microspheres are seen as small, uniform dots. On the right in FIG. 11 is seen microsphere distribution and growing exclusion zone ten minutes after exposure, at successive locations (10 mm, 25 mm, and 45 mm) along the channel.
[0070] In one implementation, the “solute” is pathogens, to be concentrated for easier identification. Thus, although an exemplary system can be used to separate salt from water, it can also be useful for separating contaminants from water.
[0071] One advantage of the exemplary differential extractor 100 is its simplicity. Once designed, it can be manufactured inexpensively, easy to keep functional, and simple to use. Portable units may operate without supply of external electrical power—by using gravity flow. In geographical regions of scarce water supply, gray water, e.g., from a shower, can be recycled, making an exemplary apparatus useful in special environments, such as space vehicles or submarines, where water is in short supply.
[0072] NAFION constitutes a powerful exclusion-generating surface in static situations, and may be superior for some applications to gels used to obtain results in flow situations such as that of FIG. 10. NAFION, a durable material, is widely used in fuel-cell applications, and can be micro-machined to contain arrays of micro fluidic channels for quick and effective separation.
[0073] In pursuing salt separation, one challenge is detection of differences in concentration of ionic species. While microspheres are detectable under bright field microscopy and fluorophores are detectable under fluorescence microscopy, direct measurements of salt concentration may require sampling of the fluids. One implementation uses a small cylindrical tube inserted near to and parallel to the (polyacrylic gels or NAFION) excluding surface. To prevent premature capillary action while the tube is being positioned, the distal end of the tube can be temporarily sealed. Once the tube is in place, the seal is removed; then fluid flows by capillary action (or can be drawn by a pump if necessary) and collected for later analysis using an osmometer.
[0074] In one implementation, the exclusion surfaces of an exemplary differential extractor 100 were obtained as follows. Convenient samples of NAFION are 180-µm-thick sheets, which can be cut for experiments. Polyacrylic acid (PAAc) can be synthesized in the laboratory. For example, a solution can be prepared by diluting 30 ml of 99% acrylic acid with 10 ml deionized water. Then, 20 mg N,N'-ethylenebisacrylamide is added as a cross-linking agent, and 90 mg potassium persulfate is added as an initiator. The solution is vigorously stirred at room temperature until all solutes are completely dissolved, and then introduced into a chamber 1.5 mm high, in which a 1-mm glass rod, later removed for cylindrical channel experiments, is suspended at mid-height. Gelation takes place as the temperature is slowly raised to about 70° C. The temperature is then maintained at 80° C. for one hour to ensure complete gelation. Synthesized gels are carefully removed from the capillary tubes, rinsed with deionized water, and stored in a large volume of deionized water, refreshed daily, for one week.
[0075] Controls can be carried out first to ensure that collection of fluid by the tube—or even the presence of the tube itself—does not interfere with the exclusion zone. One technique is to monitor the exclusion-zone boundary by optical microscopy, using microspheres (1 µm, carboxylate) as markers. Since the microspheres can be easily visualized, this method also permits the detection of any convective flows. If the tube itself compromises the zone, different materials can be used as alternates. Slow withdrawal of fluid from the exclusion zone typically does not induce much disturbance; however, if any disturbance is noted, the collection rate can be slowed until the disturbance becomes negligibly small, the tradeoff being increased time required for collection.
[0076] To sample from a broader, more representative zone, the tube can be steadily but gently withdrawn parallel to the exclusion surface during collection. Again, it may be important to test in the same way as above whether withdrawal disturbs the exclusion zone, and if necessary, collected samples can be analyzed for microsphere contamination.
[0077] Once the controls confirm the stability of a given implementation, additional controls can be carried out to test the efficacy of sampling. These tests can be carried out on NAFION and polyacrylic acid surfaces exposed to aqueous solutions of small molecular weight dyes. Dyes are ordinarily separated out satisfactorily. It is useful to confirm the absence of dye from drawn samples of different volume. These samples can be compared against standards in a fluorimeter. This helps to establish the size of sample volumes required to avoid contamination in the salt-exclusion processes.
[0078] Next, exclusion of salt can be tested. NaCl concentration can be 100 mM to start. The region of the exclusion zone immediately adjacent to the excluding surface can be sampled first, as this is the region within which salt should be most profoundly excluded. Samples drawn from this region can be tested using osmometry. Next, a micrometer drive can be used to translate the tube to a position ~100 µm more distant from the surface, and samples can again be collected. The protocol can be repeated at 100 µm intervals in order to obtain a profile of [NaCl] vs. distance from the excluding surface. A priori, in one implementation, undetectably low concentrations continue for a distance of several hundred micrometers, followed by a rapid falloff at roughly 0.5 mm from the surface. If increased measurement resolution seems warranted, smaller collection tubes can be used, and spatial increments can be reduced.
[0079] Separation can be implemented at different NaCl concentrations ranging from 1 mM up to 1 M (ordinary seawater is 0.4 M to 0.45 M). If increased detection sensitivity is required for low concentrations, atomic absorption spectrometry can be used instead of osmometry—several atomic absorption spectrometers are satisfactory for use. We have noted a diminution of exclusion-zone size with salt concentration, ~40% reduction as [NaCl] rose from nominally zero to 100 mM; hence, with the addition of salt there is a more rapid falloff of separation efficacy with distance from the excluding surface.
[0080] The separation of salts other than NaCl is possible too, as water often contains a variety of salts other than NaCl, albeit in lower quantity. The exclusion-zone size may be compromised by different salts in different ways; i.e., reduction of exclusion-zone size depends on the salt's position in the Hofmeister series, K+>Na+>Li+>Ca2+. It can be useful to verify these preliminary observations systematically, and then test the efficacy of separation of each one of them. Ideally, they can be separated with much the same efficacy of NaCl; however if these salts compromise the exclusion zone sufficiently, then collection parameters may need to be adjusted.
[0081] Other relevant variables that may be important to test for their ultimate practical value include above all, temperature and pH. The former can be evaluated by using a temperature-controlled stage during salt-separation tests, while the latter can be evaluated by adding HCl or NaOH to vary the pH between 3 and 12 with continuous pH monitoring. The optimum result reveals the absence of any strong dependence of either of these variables on efficacy of separation; however, a noted dependence can be compensated for in the implementation.
[0082] In one implementation, the exemplary technique removes sea-salts from seawater. In one process, Puget Sound seawater (Na+=410 mM) was used, and tests were carried out as above. The goal was Na+ removal effective enough to reach EPA drinking-water standards (20 mg/l, or around 0.9 mM) (http://www.epa.gov/safewater/ccl/sodium.html).
[0083] In another implementation, the exemplary technique separates bacteria and viruses from the aqueous mixture, for decontamination applications, in much the same way as salt separation was accomplished above.
Detail of Pathogen Separation
[0084] Common bacteria have a size in the micrometer range, some larger; hence, they are detectable by optical microscopy, most clearly using phase or DIC microscopy. Viruses elude practical detection by optical microscopy; hence, they can be labeled with a fluorophore and detected by fluorescence microscopy. Excluding surfaces can be the same as those used above, polyacrylic-acid gels, and NAFION. Similar collection strategies as used above can be used in this application. Various common bacteria and viruses were considered, limited to non-pathogenic varieties such as heat-inactivated samples that require no special facilities. Bacteria include: Escherichia coli (HB101) and Pseudomonas aeruginosa purchasable from American Type Culture Collection (Manassas, Va., USA). Viruses include adenovirus, SV40, and influenza available from Virapur (San Diego, Calif., USA). These can be fluorophore labeled.
[0085] Different implementations may vary the conditions used for removing the pathogens. The pH can be varied from 3 to 12 with NaOH and HCl with continuous pH monitoring, and runs can be carried out at each pH value. Salt concentration can be varied from the low level of pure water, all the way up to molar values. Temperature can be varied too, as described above.
[0086] In the case of bacteria, and unlike salt, because the exclusion zone is visually detectable, the exemplary technique can measure not only the extent of exclusion, but also the rate at which the exclusion zone develops.
[0087] These measurements are performed by abruptly exposing the exclusion surface to a suspension of bacteria, and tracking the time course of exclusion zone development. Such dynamic measurements are important features to bear in mind when a particular exemplary purification system is designed. Another aspect to keep in mind is measurement of separation dynamics during flow in cylindrical tubes (FIG. 10, above).
[0088] Having established the basic exclusionary features, including how much each type of solute is excluded and the magnitudes of the respective exclusion zones, the next step is to exploit those features in an implementation. A basic starting point is the implementation of microsphere separation during flow in cylindrical channels that was discussed above.
[0089] In one implementation, the channels are easily made: the gel is molded to contain a cylindrical glass rod, which is removed once the gel has set. In the case of NAFION, tubular samples with diameter ~0.5 nm can be obtained from the supplier. Because the NAFION wall is thin, visualizing particles or fluorescence within the channel should engender no serious difficulty.
[0090] A syringe pump is used to drive suspensions through the channel. (Improved versions of the pump can eliminate residual pulsations and result in higher precision measurements.) For test purposes, a sample may be placed on a microscope stage, flow is imposed by the pump, and the distribution of microspheres is measured at different times at a single location, and at different positions along the channel. Such tests reveal the time- and distance-dependence of exclusion prior to manufacture of the implementation.
[0091] Measurements such as those just described can be carried out on different solutes. Knowing the size of the exclusion zone in static situations (FIGS. 6-9) will shortcut the number of trials (e.g., flow rate, channel diameter and length, etc.) required to establish reasonable parameters such as flow rate for separation of salt, as well as for separation of pathogens.
[0092] For effective exclusion, different solutes may require different physical and geometric exclusion parameters. However, it may turn out that a particular set of parameters is acceptable for the exclusion not only of salt(s), but also of a range of pathogenic substances. In such a case, it may be possible to remove all of these in a single filtration pass, without requiring multiple stages. FIG. 12 shows a system for collecting purified water, i.e., a fixture designed to collect effluent from a gel separation channel. The collection system is designed to interface with the exit of the gel-separation unit; in FIG. 10, it corresponds to the collection zone 1008 on the right. The design in FIG. 12 involves a double cylinder, for collection of annular (solute-free) and core (solute-containing) flows; similar to that of FIG. 10. An initial design of the unit in FIG. 12 can be made using thin-walled stainless steel tubing. The interface end of the apparatus may be inserted into the end of the gel or NAFION channel. The inner tube or “waste outlet” is designed to catch the solute-containing fluid, and is connected to an exit tube, which either discards the fluid, or saves it for recycling. The annular ring between the inner and outer tube extracts the purified water, which flows out through a side-exit port for collection.
[0093] For both fractions, pumps may be useful to facilitate more rapid flow. Dimensions and materials for effective water collection devices may be optimized. The size of the inner cylinder is sometimes critical in ensuring that the maximum quantity of salt or impurity is removed. This follows for two reasons: (i) the salt-containing zone of the separator may need to project entirely within the collector's inner cylinder; and, (ii) the exclusion zone might not exclude uniformly, so that, for example, regions at low radius just beyond the salt-containing zone may still contain some amounts of salt whereas regions at larger radius may be truly salt free. Cylinder diameter can be carefully tested for each solute of interest. Thus, using a set “standard” for gel-channel conditions, collection ducts with a series of internal diameters can be tested to check for optimum efficacy.
[0094] It is also useful to check a series of materials other than stainless steel, including various nonreactive metals and polymers, as it is not clear a priori whether a hydrophilic or hydrophobic material will result in optimum collection. Water must flow freely into the tube; yet it should not stick excessively to the tube's walls. Hence some combination of hydrophilic and hydrophobic properties may be necessary to optimize the ability to collect. One important consideration can be the collection speed in the absence of vacuum pumping. This can be important in an effort to make the system independent of the need for external power.
Optimizing an Exemplary System
[0095] If drinking water is to be filtered from pathogenic substances, then testing should be done on ordinary drinking water to which pathogens have been added. If purification turns out not to be adequate in these situations, then backtracking can obtain adequate purification, e.g., by adding one solute at a time to pure water to determine which may be the “offending” agent.
[0096] Testing can also achieve the optimum excluding material. Polyacrylic acid gels and NAFION are good candidates, because they produce abundant exclusion. However, these surfaces are not necessarily optimal for all solutes, and there are countless other materials that can be customized for various solutes. In particular, gels and polymers studied thus far have been neutral (polyvinyl alcohol) or negatively charged (e.g., polyacrylic acid). The one positively charged surface (aminated styrene-DVB-copolymer) explored briefly gave positive results. Hence, in some cases positively charged gels (e.g., chitosan) may exclude both pathogenic substances and salt. In such a case, systematic studies including pH dependence can be carried out for optimizing the excluding material. In some instances, complementarity exists between negatively charged and positively charged surfaces, and the most effective separation may include one layer of each, or some spatial surface arrangement of positively and negatively charged regions.
[0097] Surfaces to be utilized may include functionalized monolayers (SAMS). Monolayer results obtained with exposed carboxyl groups showed ample exclusion of carboxylate microspheres. The ability to functionalize surfaces opens many possibilities in terms of ultimate manufacture.
[0098] In one implementation, the system is as independent of external electrical power as possible. It is also beneficial to balance purification efficacy with rapid throughput. Rapid throughput implies diminishing drag during flow through narrow channels. In one implementation, the friction in tubes lined with certain block co-polymers is massively diminished—by as much as three orders of magnitude (Raviv et al., 2003). If these polymers, e.g., PMMA—PSGMA, are also found to create exclusion zones for a given solute, then it is possible to achieve reasonable solute separation, while at the same time achieving substantially enhanced throughput as a result of lowered resistance—driven only by the force of gravity. In that situation, the system can operate much like a household water filter, with simple gravity-driven flow.
[0099] In one implementation, an exemplary apparatus is created through microfabrication. If the optimum channel size is in the range of hundreds of microns or less, then microfabrication can create arrays of channels. An example is shown in FIG. 13. The top of FIG. 13 is oriented upward, and the rectangles represent the excluding surfaces. The unpurified water enters at the top, and as it proceeds downward, the exclusion zone grows.
[0100] The contaminated water (stippled) exits at the bottom through a connecting channel. The purified water (clear) enters a collecting duct (broad “U” in diagram). Because identical, slab-like units are stacked upon one another, the U-shaped ducts create channels oriented normal to the plane of the diagram. Purified water is collected at the ends of those channels. Slight tilt out of the plane of the paper can bias the flow in one or the other direction, facilitating collection.
[0101] The exemplary array of FIG. 13 can operate purely by gravitational force or by pumps to facilitate flow.
Exemplary Methods
[0102] FIG. 14 shows a representative exemplary method 1400 of separating components of aqueous mixtures. In the flow diagram, the operations are summarized in individual blocks. The exemplary method 1400 may be performed by hardware, such as the exemplary differential extractor 100.
[0103] At block 1402, an aqueous mixture (suspension, solution, etc.), is flowed over a hydrophilic surface, i.e., an exclusion surface, or in some cases a hydrophobic surface. Example materials for such an exclusion surface are certain gels, polymers; NAFION, etc.
[0104] At block 1404, purified water can be collected in a first region near the hydrophilic surface. The exemplary differential extractor 100 may have an annular tube that lifts only the purified water.
[0105] At block 1404, one or more concentrated non-aqueous components of the aqueous mixture may be collected in a second region beyond the first region of the purified water, with respect to the exclusion surface. The exemplary differential extractor 100 may have a center or core tube that draws the concentrated non-aqueous components from the apparatus.
Alternative Implementation
[0106] In an alternate implementation, it has been found that solutes were excluded from a region just below the top surface of water, at the air-water interface. With a chamber (or tank) made from two large flat pieces of glass separated by 3 mm, a microsphere suspension was added, and the chamber was viewed facing one of the glass pieces. The zone just beneath the surface began to clear. Within 30 minutes a 2-mm zone (herein referred to as an exclusion zone) was fully devoid of microspheres. The exclusion zone remained devoid of microspheres for many hours. This was not the result of microsphere settling, which took place at approximately 24 hours after filling the chamber.
[0107] Other implementations to create water separation in an aqueous solution are described in an article titled “Cylindrical phase separation in colloidal suspensions,” by Kate Ovchinnikova and Gerald H. Pollack (accepted for publication in Physical Review E by the American Physical Society, January, 2009), which is hereby incorporated by reference.
[0108] An example diagram 150 of a tank 151 including an aqueous solution with an air layer, a meniscus layer, and bulk water, which may contain microspheres and is thus labeled “water+microspheres.” The clear zone, corresponds to the exclusion zone 152 is shown in FIG. 15. The exclusion zone 152 has characteristics similar to the exclusion zones described above. When the aqueous solution contains microsphere markers, not only does the zone 152 exclude those microspheres, but also its upper region has negative potential, much like exclusion zones. Further the solution remains at constant width even as the upper surface of water is lifted and moved from side to side with a vertically oriented charged rod. Hence, this zone 152 is mechanically cohesive, much like exclusion zones.
[0109] The tank 151 may be used for establishing a volume of an aqueous mixture having a surface. In addition an apparatus collects water at the surface of an aqueous mixture. The apparatus may establish an exclusion zone 152 with a depth in the aqueous mixture. In one implementation, the apparatus may collect water at the surface when the depth of the aqueous mixture is greater than approximately four times the depth of the exclusion zone 152, although any depth may be suitable provided the depth of the aqueous mixture is greater than the depth of the exclusion zone. The aqueous mixture may include a mixture of water, particles and solutes and includes particles and solutes whose removal is desired. In one implementation the depth of the exclusion zone 152 is about 2 mm.
[0110] A collection apparatus including a tube may collect water and transfer the collected water from a tank 151 to a collecting chamber. The collection apparatus may stop collecting when the water in the exclusion zone 152 has been fully transferred from the tank 151 to the collecting chamber. An apparatus may also be provided to admit more mixture to the tank 151 to let the exclusion zone 152 build for later collection.
[0111] In another implementation a skimming apparatus (as generally known) that includes the tube may continuously skim the exclusion-zone water on the surface of the aqueous solution or aqueous mixture. A controller to the skimmer may be provided to adjust the collection rate from the tank 151 to a collection chamber so that a rate of buildup of water in the exclusion zone 152 and collection of water reach a steady state.
[0112] The presence of a solute-exclusion zone at the upper surface of water provides an environment in which water can be skimmed off to provide purified water.
[0113] In one flow embodiment, a tank's 151 upper zone is connected through a downward slanted tube to a lower collecting chamber. A valve opens periodically to allow flow from tank 151 to collecting chamber to occur. The tank 151 is then replenished with the aqueous solution.
[0114] In another embodiment, an upper zone in tank 151 is set up similar to the flow embodiment except that a pump is used to facilitate withdrawal of the top layer.
[0115] In another embodiment, the upper zone of the tank 151 is set up similar to the flow embodiment except that multiple stages are used to achieve further purification.
Illustrative Fraction Collection
[0116] FIG. 16 is a diagram illustrating principal features of an apparatus 1602 for collecting a fraction of a mixture, suspension, or solution of a polar liquid, according to an embodiment. As used herein, a fraction is defined as a concentration of a mixed component, suspended component, or solute different from other concentrations of the mixed component, suspended component, or solute at different distances from an interface 1610 (described below).
[0117] A first collector 1604 such as a collection tube is configured to collect a fraction of a mixture, suspension, or solution of a polar liquid 1606, 1608 at a selected distance at or away from an interface 1610 between the polar liquid and air or a hydrophilic surface 1612. A structure 1605 is configured to hold the first collector 1604 at the selected distance. A first fraction collected from a first region 1608 at a first distance at or away from the interface 1610 may comprise substantially pure polar liquid. A second fraction collected at a second distance away from the interface in the second region beyond a boundary 1614 comprises a an increased concentration of a solute or particle component compared to the first fraction. The first region 1608 is also referred to as an exclusion zone that is formed by an interaction between the polar fluid 1606, 1608 and the air or hydrophilic surface 1612 according to mechanisms described herein. The polar liquid 1606, 1608 may be water.
[0118] According to an embodiment, the first collector may be held at the first distance selected to collect the first fraction comprising substantially pure polar liquid from the first region 1608 (exclusion zone), as shown. In some embodiments, the first region may extend to a distance of about 2 mm from the interface 1610, where it forms the border 1614 with the second region.
[0119] Alternatively, the first collector may held at the second distance beyond the boundary 1614 selected to collect the second fraction comprising the increased concentration of the solute or particle component (configuration not shown). Alternatively a first collector 1604 may be held at a first distance selected to collect the first fraction comprising substantially pure polar fluid from the first region, and a second collector (not shown) may be held to collect the second fraction comprising the increased concentration of the solute or particle component from the second region. Alternatively, a larger number of collectors 1604 may be held to collect various fractions. Such collectors 1604 may be configured to each collect potentially a different fraction from a different distance from the interface 1610, or may be configured to collect substantially the same fraction at substantially the same distance from the interface 1610.
[0120] The structure 1605 may be configured to hold the first collector 1604 in a substantially constant position at or away from the interface 1610 between the polar liquid 1606, 1608 and air or a hydrophilic surface 1612. For example, the structure 1605 may include a float configured to provide buoyancy to hold the collector 1604, and/or other associated hardware or liquid near the surface 1610 or an air 1612 interface. Optionally, the apparatus 1602 may include a vessel (not shown) for holding the mixture, suspension, or solution of the polar liquid 1606, 1608.
[0121] FIGS. 3, 4, 6, 7, 8, 9, 11, and 15 illustrate sensing or output from sensing one or more of a position of the interface 1610; a depth of an interface 1614 between first and second regions corresponding to an exclusion zone 1608 and concentrated phase, respectively; a concentration of a mixed component, suspended component. Moreover, referring to FIG. 16, a concentration of a mixed component, suspended component, or solute collected 1624 by the fraction collector 1604 through an opening 1622 may be sensed. For example, referring to FIG. 3, the exclusion zone 110 and microspheres 102 (aka, the concentrated phase) are visualized from an optical detection technique, in this case sensing using a focal plane array image sensor coupled to receive an image through microscope optics. Similarly, FIG. 4 (as described by paragraph 38) shows optical absorbance profiles used to characterize and determine differences between the exclusion zone (aka, diluted) and the concentrated phase. Thus, an optical sensor can be used to determine the presence or absence of a solute or suspension at various locations relative to a fraction collector.
[0122] Electrical sensing may also be performed to determine characteristics and location of an interface, exclusion zone, and concentrated or “bulk” phase. For example, the concentration of a salt solution can be correlated to the electrical conductivity of the solution. Thus an electrical sensor can be used to determine characteristics and location of an interface, exclusion zone, and concentrated or “bulk” phase. Such a sensor may be made to measure presence/absence of a polar liquid, and/or conductivity or resistivity of the polar liquid at various locations (e.g., distances from an exclusion zone-forming interface 1610) in a solution.
[0123] Moreover, as described above, a structure (e.g. including an actuator such as a micrometer drive) to hold and/or move a collection tube 1604.
[0124] A sensor 1616 may similarly provide feedback to a control system to determine a collection location of a collection tube 1604, for example to establish or maintain collection of a selected fraction of the polar liquid and mixed, suspended, or dissolved particles or solutes. According to an embodiment, the selected fraction may be substantially pure polar liquid. According to another embodiment, the selected fraction may include an enriched concentration of suspended or dissolved particles or solutes. Similarly, a sensor 1616 may be used to provide feedback for selecting one or more of a plurality of collectors 1604 for collection.
[0125] Referring to FIG. 16, the structure 1605 may be configured to hold the first collector 1604 at an adjustable 1634 distance at or away from the interface 1610 between the polar liquid and air or a hydrophilic surface. One or more sensors 1616 may be configured to sense and output a sensor signal or data corresponding to one or more of a position 1618 of the interface between the polar liquid and air or a hydrophilic surface; a position 1620 of an interface 1614 between the first and second regions; a concentration of a mixed component, suspended component, or solute in the vicinity 1624 of the first collector 1604 (and/or any second collector), such as near the intake 1622 of the first collector 1604; or a concentration of a mixed component, suspended component, or solute collected 1626 by the first collector 1604 (and/or any second collector).
[0126] A sensor signal or sensor data may be output by the sensor 1616 to programmable logic 1628 such as a microcontroller, state machine, PID controller, or other apparatus configured to drive an actuator 1630 configured to adjust the position of the first collector 1604 (and/or any second collector) responsive to the sensor signal or data. For example, a rate of liquid collection may be decreased or stopped by controlling a pump or valve 1632 if a boundary 1614 between the exclusion zone 1608 and bulk fluid containing suspended particles or solute approaches a location 1620 too close to a liquid intake 1622. Similarly, the distance (depth) of the collector 1602 may be set as a function of a detected location 1618 of the interface 1610 by actuating the position or configuration 1634 of the structure 1605.
[0127] The sensor 1616 may use one or more of a variety of technologies to sense conditions relevant to liquid collection by the collector 1604. For example, the sensor may be an optical sensor, an ultrasonic or sonic sensor, or an electrical sensor.
[0128] For example, an optical sensor 1616 can measure scattering caused by particles in the polar liquid 1606, 1608. Additionally or alternatively, an optical sensor 1616 can measure an absorption characteristic of a spectrum of a solute or suspension. Additionally or alternatively, an optical sensor 1616 can measure specular reflection off an air/liquid interface 1610, and given a characteristic exclusion zone 1608 thickness, one can infer the distance to the bottom 1614, 1620 of the exclusion zone. In systems where the polar liquid is water, the exclusion zone 1608 was found to strongly absorb 270 nanometer ultraviolet light. The sensor 1616 can thus measure 270 nanometer absorption (or another absorption spectrum characteristic of an exclusion zone 1608 of water or another polar liquid), and optionally one or more reference wavelengths, to determine or infer the presence or thickness of the exclusion zone 1608. Accordingly, one or more optical characteristics may be measured by the sensor 1616 and output used by the logic 1628 to drive the actuator 1630.
[0129] Similarly, electrical characteristics of the exclusion zone 1608 and bulk or component-enriched polar liquid 1606 beyond the border 1614 of the exclusion zone may differ. Conductivity or electrical potential may, for example, be sensed by the sensor 1616 at one or more various locations 1612, 1618, 1620, 1624, 1626, and output used by the logic 1628 to drive the actuator 1630. Alternatively a sonic or ultrasonic transmission or reflection characteristic may be measured by the sensor 1616 and output used by the logic 1628 to drive the actuator 1630.
[0130] The actuator 1630 may be configured to adjust a pump or valve 1632 configured to control a rate of removal of the fraction by the first collector 1604. According to an embodiment, adjustment of a pump or valve 1632 may be used to select between collection by a plurality of collectors 1604. Alternatively or additionally, the actuator 1630 may be configured to adjust a position 1634 in which the structure 1605 holds the collector 1604. The logic 1628 may receive the sensor signal or data and responsively drive the actuator to establish or maintain a desired collection fraction.
SEPARATING
COMPONENTS OF AQUEOUS MIXTURES, SUSPENSIONS, AND SOLUTIONS
US 7819259 / US7793788
US 7819259 / US7793788
Systems and methods are described for separating components of aqueous mixtures, including aqueous solutions and suspensions. In one implementation, an apparatus flows the aqueous mixture over a hydrophilic surface to form a first region of purified water and a second region of at least one concentrated non-aqueous component. The apparatus can draw off either the purified water or the concentrated non-aqueous components. In one implementation, an array of tubules performs the differential extraction. In another implementation, various hydrophilic and/or hydrophobic surfaces are disposed in multiple differential extractors and some effluents may be recycled to perform complex assaying and separation. In a further implementation, an apparatus can draw off purified water just beneath the air-water interface.
BACKGROUND
[0003] There is great need for purified water. Water demands are increasing worldwide, while water sources are becoming increasingly rare. Hence, any inexpensive method that can convert salt water to potable water would be extremely valuable. In very confined environments such as space vehicles or submarines where fresh water sources are scarce, water purification and recycling can be critically important. A method that converts “used” water—such as, black water, gray water, waste water, or even urine—into drinking water, is invaluable.
[0004] Likewise, there is a need for improved and alternative techniques for separating solutes, suspended particles, bio-organisms, etc., from aqueous mixtures, suspensions, and solutions—not necessarily to obtain pure water, but to collect and concentrate the non-aqueous components, e.g., to collect a product or for qualitative and quantitative analysis.
SUMMARY
[0005] Systems and methods are described for separating components of aqueous mixtures, including aqueous solutions and suspensions. In one implementation, an apparatus flows the aqueous mixture over a hydrophilic surface to form a first region of purified water and a second region of at least one concentrated non-aqueous component. The apparatus can draw off either the purified water or the concentrated non-aqueous components. In one implementation, an array of tubules performs the differential extraction. In another implementation, various hydrophilic and/or hydrophobic surfaces are disposed in multiple differential extractors and some effluents may be recycled to perform complex assaying and separation. In another implementation an apparatus can draw off purified water just beneath the air-water interface.
BRIEF DESCRIPTION OF THE DRAWINGS
[0006] FIG. 1 is a diagram of an exemplary differential extractor for separating components of aqueous mixtures.
[0007] FIG. 2 is a diagram of exemplary dimensions of one implementation of the differential extractor of FIG. 1.
[0008] FIG. 3 is a diagram of an exemplary system for separating components of aqueous mixtures.
[0009] FIG. 4 is a diagram of concentration gradients achieved by an exemplary system.
[0010] FIG. 5 is a diagram of swelling of an exemplary material used in a differential extractor.
[0011] FIG. 6 is a diagram of exemplary solute exclusion.
[0012] FIG. 7 is a diagram of growth of an exemplary exclusion zone over time.
[0013] FIG. 8 is a diagram of exemplary separation of a protein from an aqueous mixture.
[0014] FIG. 9 is a diagram of exemplary separation of a dye from an aqueous mixture.
[0015] FIG. 10 is a diagram of an exemplary interface between a gel exclusion surface and a collector.
[0016] FIG. 11 is a diagram of an exemplary exclusion zone over time and at different distances along an exclusion surface.
[0017] FIG. 12 is a diagram of an exemplary extraction apparatus to interface with a gel exclusion channel.
[0018] FIG. 13 is a diagram of an exemplary array of differential extractors.
[0019] FIG. 14 is a flow diagram of an exemplary method of separating components of aqueous mixtures.
[0020] FIG. 15 is diagram of an exemplary exclusion zone just beneath an air-water interface.


DETAILED DESCRIPTION
Overview
[0021] This disclosure describes separating components of aqueous mixtures, suspensions, and solutions. The term “aqueous mixture” will be used herein to represent an aqueous mixture, suspension, or solution. To separate components, the aqueous mixture is exposed to a hydrophilic surface, such as the inside of tubes made of hydrophilic materials. A region of “purified water” forms near the hydrophilic surface in which one or more solutes or other non-aqueous components are partially or entirely excluded. Hence, the hydrophilic surface is also referred to herein as an “exclusion surface.” Likewise, a region of “concentrated solute” forms “away from” the exclusion surface. Thus, the gradient caused by the exclusion surface can be exploited to obtain purified water or to obtain a higher concentration of a non-aqueous component.
[0022] Such aqueous mixtures include salt solutions, colloids, suspensions, waste water, bodily fluids, mining tailings, etc., that is, most any combination of water and another compound or substance. Non-aqueous components of an aqueous mixture can include organic and inorganic salts, biomatter, pathogens, bacteria etc., and many other solids and semi-solids. For example, the exemplary techniques to be described herein can separate microspheres that are similar in size to bacteria to easily obtain a 20:1 separation.
[0023] In one implementation, an exemplary method removes salts from water to obtain efficient desalination. The salts to be separated can include sodium chloride, seawater salts, components of buffer solutions, and many other salts and ionic compounds. Hence, exemplary methods can separate ionic (charged) components from water mixtures, or can separate neutral, non-ionic species from water mixtures too.
[0024] From another perspective, the subject matter to be described can concentrate dissolved or suspended species from aqueous solutions. That is, instead of pure water being the only desired product, an exemplary method can be used to concentrate the non-aqueous components of an aqueous mixture. This can be useful in many manufacturing processes and in the clinical lab, e.g., for diagnosing medical conditions via blood work and other physiological tests that involve bodily or cellular fluids. The exemplary methods described herein can be used to separate and/or concentrate salts, pathogens, contaminants, dyes, organic and inorganic species, etc., from aqueous mixtures. Solute size can be as small as a few nanometers (e.g., molecular weight of approximately 300).
[0025] In one implementation, multiple separation stages are performed in series, including, for example, a cascade of multiple similar stages iterated to amplify the effect, as well as variegated stages for different materials. Thus, process flow may follow a tree structure or flow diagram analogous to complex stages of a chemical synthesis or purification, in which different components are separated or concentrated at different times and in different quantities by different implementations or instances of the exemplary exclusion surface. The succession of stages allows an exemplary process to exclude more types of solutes from an increasingly purer aqueous mixture. The succession can also improve the purification of a single material, e.g., to automatically obtain a super pure product in the lab. Moreover, a user can specify which non-aqueous species are to be separated out or concentrated from an aqueous mixture.
Exemplary Process
[0026] We found that many solutes were excluded from a region adjacent to hydrophilic surfaces. Included among the excluded species were microspheres of various size, erythrocytes, proteins, and even small molecular weight dyes. Salts also appeared to be excluded. The exclusion zone varied in size, but in one implementation was several hundred micrometers wide. Given the large size of this zone, and the exclusion of many solutes, we discovered that the exclusion zone contained “pure” water, which could then be harvested. The formation of the exclusion zone was similar to the formation of ice—which crystallizes to the exclusion of foreign materials in its molecular structure.
[0027] In general, negatively charged surfaces exclude negatively charged solutes, and positively charged surfaces exclude positively charged solutes. So, for many different solutes, a surface can be selected that will exclude solutes from a region of pure or purer water. Bacteria, viruses, etc., fall into size and charge domains as solutes that we typically tested, so these too can be excluded from the region of purified water. Biological specimens, such as red blood cells, were also excluded from this region. It is worth noting that negatively charged surfaces do, in general, exclude negatively charged solutes; however, some positively charged solutes are excluded as well. Similarly, positively charged surfaces generally exclude positively charged solutes, but also some negatively charged solutes as well.
Flow Profile Measurements
[0028] An initial issue to be tested was whether the water in such an exclusion zone near a surface was or was not bound to the nucleating surface (i.e., a gel, polymer, or other exclusion surface). If the water adhered tightly, then removal would not be easily possible. To pursue this question we used polyacrylic acid gels, with characteristic dimensions of several centimeters, containing a 2-mm channel. Because the gel was clear, the channel could be visualized using an optical microscope. Microsphere suspensions were forced through the channel under pressure. At the entryway, microspheres were uniformly distributed across the cross section. Farther along the channel, an exclusion zone developed: the annulus was clear, while the core region contained concentrated spheres. Still farther along, the clear annulus grew at the expense of the core, and ultimately, after several centimeters, the relative dimensions of annulus and core no longer changed.
[0029] To assess whether annular water adhered to the gel surface, we measured volume flow at intervals of several millimeters along the channel. The profile could be measured only in the core, where microspheres were present, and not in the annulus, where there were no markers. Thus, the complete profile could be measured near the entryway, while only partial profiles could be measured farther along. Each profile was integrated to give volume flow. Thus, we could obtain volume flows in the microsphere-containing zones at intervals along the channel. If the integrated flows were equal at all points, then we would have concluded that the annular regions were adherent; only the microsphere-containing regions flowed. By contrast, we found that the integrated profiles diminished significantly with distance along the channel. This meant that volume flow in the microsphere zones decreased progressively along the channel. Or, in other words, some of the flow had to come from the clear annulus. We established that the annular region did, indeed, flow (at least in part), making possible the exemplary techniques.
Apparatus for Solute Separation
[0030] As shown in FIG. 1, an exemplary “differential extractor” 100 separates a solution into concentrated and dilute (clear) fractions. The principle of the extraction is also illustrated in FIG. 1. A homogenous microsphere suspension 102 enters a NAFION tube 104 at one end (DuPont Corporation, Wilmington, Del.). NAFION is a Teflon-like polymer with exposed sulfonate groups, used in fuel cells, actuators, and other applications. In one implementation, NAFION was found to be an ideal exclusion surface and will be referred to herein as a representative material for the exemplary exclusion surface, although other materials can also be used for the exclusion surface. As the solution travels through the NAFION tube 104, the microspheres 102 migrate from the walls 106 of the tube 104 and gather in the core region 108. Clear water from the exclusion zone 110 and microsphere-containing water 112 pass through different channels of the extractor 100, and are then collected. In one implementation, the differential extractor 100 is used to extract clear water.
[0031] In FIG. 2, the dimensions of one implementation of the exemplary differential extractor 100 are given. An elevation view 202 shows the two different channels that draw off the concentrated and diluted products of the separation. Of course, either the concentrated or diluted products of the extractor 100 can be subjected to subsequent instances of the extractor 100 to provide further concentration or dilution of the particular product. The concentration branch or the dilution branch of the extractor 100 can even be looped back to the input of the NAFION tube to recycle the particular product multiple times through the same extractor 100.
[0032] Another implementation of an extraction schema is shown in FIG. 3. Pump “1” 302 and Pump “2” 304 reduce the pressure in the peripheral channel and the center channel, respectively, to facilitate collection. Pressure reduction in the channels results in inflow of solution into the channels with linear velocity proportional to the negative pressure generated by each pump. The negative pressures can be adjusted so that the linear velocity is equal in both channels. The concentrated and dilute solutions can be collected in different syringes. Importantly, in this implementation, the tube 104 itself can be immersed in the, e.g., microsphere 102 (or salt) solution. Hence, the initial concentration in the solution outside the tube 104 is the same as that of the solution inside.
[0033] Three differential extractors 100 are described as examples. In one implementation, the extractor 100 is constructed with glue. Brass bushings are used for maintaining tube concentricity. The proximal end of the extractor 100 is initially flush. This implementation shows that the exemplary extractor 100 can be made of diverse materials, as long as they are impervious to the components being separated.
[0034] In another implementation, the extractor 100 can be constructed from stainless steel tubing, and overall lengths can be increased to accommodate some different features. In this case, the extractor 100 incorporates an extension sleeve on the outer tubing to increase extraction efficiency.
[0035] In yet another implementation, the differential extractor 100 has larger diameter stainless steel tubing to accommodate a relatively larger NAFION tubing 104 that, especially effective for some applications. For example, construction can be carried out with low temperature silver solder, and concentricity can be maintained by dimpling the outer tube. The distance between inner and outer tube, the annulus, can be approximately 0.1 mm. Also, the central tube, used to collect highly concentrated microspheres, can be extended out 0.5 mm at the proximal end. This makes it possible to visualize the extraction process microscopically. This, in turn, may allow flows to be regulated in a sensitive manner to match the relative size of the exclusion zones. In one implementation, the smaller the exclusion zone 110, the larger should be the difference of flow in order to achieve good separation. Given the availability of a sensitive manner of adjusting flows, 10-20 times concentration difference can be obtained (e.g., see images in FIG. 1).
[0036] The particular geometry and materials employed in the exemplary extractor 100 can be varied to improve results for a particular application. For instance, a polyacrylic-acid gel may also be used as the exclusion surface.
[0037] In one implementation, particles in the micron-size range can be separated out of water using the exemplary techniques. Depending on refinement of the implementation, the extractor 100 may achieve a 10:1 or 20:1 concentration difference ratio between purified water and microsphere enriched output. With multiple extraction stages in series, e.g., using different extraction surfaces, superb separation ratios are achievable. Separating (micron-sized) pathogens is therefore possible.
Spectrophotometric Studies
[0038] In one implementation, relatively slow flow in the NAFION tube is maintained in order to prevent turbulence, which increases reliability and may be used in circumstances in which the speed of extraction is of secondary importance. For example, in a model implementation, 100 ml of concentrated and 10 ml of dilute solution were collected over 10-12 hours.
[0039] An exemplary method was adopted to detect even small differences in concentration. We found that spectrophotometer readings gave the first sign of successful separation, albeit sometimes they were very small. After two fractions were collected, absorption spectra were obtained for concentrated and dilute species using a UV-VIS spectrometer. Examples of absorption curves are shown in FIG. 4, where the upper curve corresponds to the concentrated fraction and the lower curve corresponds to the purified fraction. The result corresponds to one implementation, in which the separation ratio was relatively low, approximately 1:2 or 1:3. Early development of the separation principle also showed that the spectrophotometric method could be used as a sensitive detector of even subtle differences between fractions.
Microsphere Counting
[0040] After the spectrophotometric approach for detecting a concentration gradient was pursued, an initial gel implementation was replaced by the NAFION tubing described above, and improved extractors were thereby developed. As development of exemplary methods progressed, the concentration difference between fractions grew sufficiently large, up to 20:1, that it could be seen by the naked eye, or measured accurately by use of a microscope.
[0041] Thin layers of the concentrated and dilute fractions were therefore created and viewed with a microscope. Since the microscope has a finite depth of field, direct counting of microspheres in the field gives the number within some fixed volume, i.e., the concentration. By comparing the number of the microspheres in the respective fractions, the concentration difference could be ascertained. In one phase of development, approximately ten experiments were carried out. The layers of solution were of the same thickness, ca. 0.1 mm. The area was 1-2 square cm.
[0042] One result obtained using this approach showed a separation of between approximately 10:1 to 20:1. However, in this implementation the ratio was strongly dependent on the desired collection rate. If water from the outer annulus was drawn very slowly, we estimate that, practically, it will be possible to obtain separation coefficients of 100:1 or even higher—mainly because the exclusion zone never contains microspheres, even when the microsphere concentration is raised to high values.
Further Experimental Details
[0043] Initial microsphere concentration was 2.84×10exp6 particles/ml in most experiments during development. In the photographs presented, the initial solution concentration was 1.13×10exp7 particles/ml. POLYBEAD Carboxylate 2.0 µm microspheres were used and were diluted in distilled water (Polysciences, Inc., Warrington, Pa.).
[0044] The extraction speed, i.e., the volume flow inside the NAFION tube, was 1 ml/hour if the experiment was conducted overnight or 4-5 ml/hour during the daytime. With this speed, we collected 2 ml of dilute solution per 10 ml of concentrated solution; generally this took 2.5 hours.
[0000] Salt Separation & Small Osmolality Difference Measured with the Osmometer
[0045] After experiments with the microspheres were carried out, we began experiments with salt solutions (e.g., sodium chloride, ~500 mmol/l). Initially, these experiments were carried out the same way as with the microspheres solution. The experimental setup was similar or the same, although a microscope was not used for adjusting the flow velocity because no microsphere markers were present. Of seven example experiments conducted, four showed osmolality difference between “concentrated” and “dilute” fractions. Experimental results for these are shown in the Table (1) below.
[0000]
TABLE 1[mathematical formula]
No of Experiment No of Measurements “Diluted” Solution Concentration, mmol/l (Dc) “Concentrated” Solution Concentration, mmol/l (Cc) Cc-Dc Cc - Dc Dc ? 100 ? % Average %
1 1 466 499 33 7.08% 7.53%
2 467 505 38 8.14%
3 475 510 35 7.37%
2 1 673 733 60 8.92% 7.81%
2 687 733 46 6.70%
3 690 744 54 7.83%
3 1 630 651 21 3.33% 3.10%
2 632 651 19 3.01%
3 644 663 19 2.95%
4 1 964 1001 37 3.84% 5.23%
2 984 1032 48 4.88%
3 1005 1075 70 6.97%
[0046] The repeatability of the salt solution separation measurements in each experiment was significantly high. In some circumstances, it may be that the exclusion zone is considerably smaller with high concentrations of salt than with microspheres in pure water; hence, the outer annulus collected some pure water and mostly salt water. A collector with smaller annulus can be built for salt exclusion.
NAFION Tube Swelling Experiments
[0047] We observed that sometimes, some grades of NAFION swell less in salt solutions than in pure water. The higher the osmolality, the less the NAFION swells. Thus, one possibility is that salt ions are held by the water molecules—they do not enter the NAFION polymer, either within the NAFION wall itself, or immediately around the wall. In other words, they may not penetrate into the exclusion zone.
[0048] We hypothesized that if salt ions do not enter in or around the polymer network, then, as the NAFION swells, the salt concentration of the solution used to swell the NAFION becomes higher. This hypothesis was tested in the following experiment. First, a salt solution of known concentration was pumped inside the dry NAFION tube. The outside of the tube was dry. After approximately 10 minutes the NAFION tube swelled, at the expense of the solution inside. Then, the remaining solution was pumped out of the NAFION tube, and its osmolality was measured. Three experiments were carried out. Each time, there was an osmolality increase following swelling (see Table (2) below). Hence, the results support the hypothesis: it appears that salt is excluded from around the NAFION polymer; only water appears to enter.
[0049] To check this result, calculations were made based on the assumption that only water molecules enter the NAFION polymer network. The NAFION tube was weighed as shown in FIG. 5, before and after swelling, and therefore the amount of water that enters was known. With this data, it can be calculated what the predicted concentration increase in the tube's lumen should be. Table (2) below shows excellent agreement, within several percent. Hence, the assumption that no salt enters in/around the NAFION polymer was tentatively validated.
[0050] Controls were made to test the possibility that the observed increase of osmolality might arise artifactually, from some chemicals diffusing out of the NAFION. This possibility was tested by swelling the NAFION in deionized water instead of salt water. The solution removed from the NAFION tube showed no measurable increase of osmolarity. Hence, the increase of osmolality in Table (2) below was considered to have arisen from salt, excluded from the NAFION network.
[0051] There may be a distinction between the water lying within, and immediately outside of, the NAFION tubing. Both are in the vicinity of polymer. If they behave similarly, then salt is deemed to be definitely absent from the exclusion zone. If not, then it is possible that the salt is excluded only from the water fraction lying within the tubing, but not from the fraction adjacent to it.
[0000]
TABLE 2
Solution Solution concentration concentration Predicted before NAFION after NAFION Solution swelled (mM) swelled (mM) concentration (mM) % error
398 484 470 2.3
401 475 455 4.2
422 480 464 3.3
ALTERNATE EMBODIMENTS
[0052] When experimenting with microsphere suspensions, we found that it is possible to draw small amounts of microsphere-free water from the exclusion zone. Practical success depends on how small the exclusion zone is with salt present. In the case of salt solutions, a NAFION tube can be used to create an exclusion zone. Then, a micropipette with tip diameter of, for example, 10 µm can be used to suck water via a tiny opening adjacent to the NAFION surface. By repeating this many times in a model setup, it is possible to collect solution, e.g., enough solution for osmolality measurements. Alternatively, a single step sample can be used to collect a very small amount of water. Speed of evaporation of this solution can be compared with evaporation of the solution taken farther from the NAFION surface. Practically salt-free water should evaporate more rapidly than relatively salty water.
[0053] Another measurement approach uses a sodium-sensitive electrode. These can be obtained with tips on the order of 1 mm, and even smaller tips may be available. If the exclusion zone is large enough, then the electrode should reveal the spatial distribution of concentration in the vicinity of NAFION. If necessary, the concentration of salt could be reduced to expand the exclusion zone.
[0054] In one implementation, an extractor collects water from a narrow annulus, e.g., much narrower than the 100 µm used in one implementation in the lab. This facilitates collection of water in situations in which the exclusion zone is much smaller than is the case with microspheres. A NAFION (or equivalent polymer) tube with an array of small holes may also be used, so that the relatively sodium-free water exits outside the tube rather than from an annulus within the tube.
Using Electrical Potential to Increase the Size of the Exclusion Zone
[0055] Electrical potentials may also be applied to increase the size of the exclusion zone and hence the efficacy of separation. For example, in one implementation water molecules migrate toward a negatively charged (cathode) surface. That is, the applied charge enhances the hydrophilic character of the exclusion surface, thereby increasing the region of purified water.
[0056] In another implementation, a potential difference is applied between parallel wires several cm apart in an aqueous mixture, suspension, or solution. For example, with five volts between the wires, microsphere exclusion may increase to a centimeter or more from the negative electrode. With proper choice of material for the wire(s), (e.g., similar to materials used in maintenance-free auto batteries) bubbles (electrolysis) are virtually absent.
Further Detail
[0057] One objective during development was to lay groundwork for an exemplary device that can separate salt and other solutes from water. To design such a device, we observed that solutes tend to be excluded from the zone adjacent to many hydrophilic surfaces. Solutes observed to be excluded ranged from micron-sized colloidal solutes, for example, down to small molecular weight dyes. Hydrophilic surfaces that exclude these solutes include various hydrogels and polymeric surfaces. Exclusion is seen not only in static situations but also when the aqueous suspension or solution flows in channels cut inside of gels, and this formed the basis for several implementations of the exemplary device.
[0058] In one implementation, salt water, or otherwise contaminated water, flows into the gel or polymer channel, and the salt molecules progressively migrate from the wall toward the channel axis (center of the tube).
[0059] This concentrated solution in the channel core is discarded or recycled, while the pure water in the annular region (i.e., outer region of the tube lumen) is collected. Variations of the exemplary technique were tested under a series of experimental conditions, in order to optimize purification and throughput.
[0060] In one implementation, as described above, we examined microspheres suspended in aqueous solution in the vicinity of hydrogel surfaces. The microspheres translated away from the surface, leaving a microsphere-free zone that was unexpectedly large relative to expectations of classical theory (Israelachvili, 1992): depending on conditions, the microsphere-free zone was on the order of 100 µm or more. Because the depletion of microspheres from the vicinal zone left pure water, this principle can be applied to the separation of suspended or dissolved entities, including salt.
[0061] An example of this kind of exclusion is shown in FIG. 6. The gel-water boundaries are the vertically oriented, thin, white lines. (The vertically oriented fuzzy band to the right of “gel” is an optical reflection artifact.) Microspheres migrated away from the gel surface, leaving, within minutes, a zone ~250 µm that was devoid of microspheres.
[0062] FIG. 7 shows another example of exemplary solute exclusion. In FIG. 7, the exclusion-inducing surface is again NAFION. FIG. 7 shows a time-dependent buildup of the solute exclusion zone, which typically grows in minutes to 0.5 mm or more.
[0063] Our subsequent studies have shown the exemplary exclusion methods to be generally applicable. Exemplary exclusion was observed not only in the vicinity of a series of synthetic and natural hydrogels, but also near other hydrophilic surfaces including carboxylated monolayers, PEGylated surfaces, and biological surfaces (muscle and vascular endothelium). In various implementations, excluded species include microspheres of either charge polarity, red blood cells, ion-exclusion resin beads, fluorophore-labeled protein (albumin—as shown in FIG. 8), and various low molecular weight dyes. FIG. 9, for example, shows the time course for exclusion of the fluorophore, sodium fluorescein, in the vicinity of NAFION.
[0064] In both cases in FIGS. 8 and 9, these relatively low molecular weight solutes are excluded at least qualitatively by an amount similar to the much larger colloidal microspheres. Thus, the size range of excluded species can be broad—from micron-sized particles down to small molecules. All of these solutes, suspensions, etc., are excluded from vicinal water, presumably by some surface induced alteration of that water. In one implementation, we derived evidence that at least three physical features of the vicinal water are different from bulk water: NMR hydrogen nuclei relaxation times; ability to support sustained potential difference; and sharply diminished infrared radiation from the vicinal water zone.
[0065] Considering the broad size range of solutes confirmed to be excluded (12 orders of magnitude in mass), molecules beyond this range, i.e., even smaller than the lowest molecular weight dyes (e.g., mol. wt. 376) can be excluded as well.
[0066] In some experiments, we built polyacrylic acid gels (also some polyvinyl alcohol gels) containing long, cylindrical channels, as shown in FIG. 10. Solute-containing water is pumped through the channel; or, in the case of a vertically oriented channel, the suspension can flow by the force of gravity; external power is then unnecessary. At the entry, the solute is distributed uniformly over the cross-section. Farther along the channel, the solute can be progressively excluded from the zone just inside the gel. With sufficient tube length, the sub-annular region will be solute free for practical purposes, or, actually solute free given a theoretically long enough tube.
[0067] This solute-free water can then be collected using an annular channel 1002 whose outer diameter 1004 is equal to the inner diameter of the gel (FIG. 10, right side). The solute-containing water in the collection zone 1008 is in the center, i.e., inside the annular solute-free zone being collected by the annular channel 1002. When the solute-containing water is in short supply (e.g., the solute is precious), the solute-containing water can be recovered, so that the process can be repeated in cascading stages.
[0068] As shown in FIG. 11, some initial studies were carried out using 1-µm carboxylate microspheres, easily detectable with a compound microscope. Polyacrylic acid gels were molded to contain a cylindrical channel, 1.6 mm in diameter 50 mm long. Using a motor-driven syringe, suspensions of microspheres were driven through the channel. Because the gel was clear, the microspheres within the channel could be easily visualized. Clear, stable, exclusion zones increased with time (and increased faster with smaller molecular weight substances; see FIGS. 8 and 9), and grew to appreciable size at distances sufficiently far from the entry orifice. From the left, FIG. 11 shows the time course of microsphere distribution 45 mm from entry point at various times after exposure to suspension. The gel boundary is the dark region at top. At this low magnification, microspheres are seen as small, uniform dots. On the right in FIG. 11 is seen microsphere distribution and growing exclusion zone ten minutes after exposure, at successive locations (10 mm, 25 mm, and 45 mm) along the channel.
[0069] In one implementation, the “solute” is pathogens, to be concentrated for easier identification. Thus, although an exemplary system can be used to separate salt from water, it can also be useful for separating contaminants from water.
[0070] One advantage of the exemplary differential extractor 100 is its simplicity. Once designed, it can be manufactured inexpensively, easy to keep functional, and simple to use. Portable units may operate without supply of external electrical power—by using gravity flow. In geographical regions of scarce water supply, gray water, e.g., from a shower, can be recycled, making an exemplary apparatus useful in special environments, such as space vehicles or submarines, where water is in short supply.
[0071] NAFION constitutes a powerful exclusion-generating surface in static situations, and may be superior for some applications to gels used to obtain results in flow situations such as that of FIG. 10. NAFION, a durable material, is widely used in fuel-cell applications, and can be micro-machined to contain arrays of micro fluidic channels for quick and effective separation.
[0072] In pursuing salt separation, one challenge is detection of differences in concentration of ionic species. While microspheres are detectable under bright field microscopy and fluorophores are detectable under fluorescence microscopy, direct measurements of salt concentration may require sampling of the fluids. One implementation uses a small cylindrical tube inserted near to and parallel to the (polyacrylic gels or NAFION) excluding surface. To prevent premature capillary action while the tube is being positioned, the distal end of the tube can be temporarily sealed. Once the tube is in place, the seal is removed; then fluid flows by capillary action (or can be drawn by a pump if necessary) and collected for later analysis using an osmometer.
[0073] In one implementation, the exclusion surfaces of an exemplary differential extractor 100 were obtained as follows. Convenient samples of NAFION are 180-µm-thick sheets, which can be cut for experiments. Polyacrylic acid (PAAc) can be synthesized in the laboratory. For example, a solution can be prepared by diluting 30 ml of 99% acrylic acid with 10 ml deionized water. Then, 20 mg N,N'-ethylenebisacrylamide is added as a cross-linking agent, and 90 mg potassium persulfate is added as an initiator. The solution is vigorously stirred at room temperature until all solutes are completely dissolved, and then introduced into a chamber 1.5 mm high, in which a 1-mm glass rod, later removed for cylindrical channel experiments, is suspended at mid-height. Gelation takes place as the temperature is slowly raised to about 70° C. The temperature is then maintained at 80° C. for one hour to ensure complete gelation. Synthesized gels are carefully removed from the capillary tubes, rinsed with deionized water, and stored in a large volume of deionized water, refreshed daily, for one week.
[0074] Controls can be carried out first to ensure that collection of fluid by the tube—or even the presence of the tube itself—does not interfere with the exclusion zone. One technique is to monitor the exclusion-zone boundary by optical microscopy, using microspheres (1 µm, carboxylate) as markers. Since the microspheres can be easily visualized, this method also permits the detection of any convective flows. If the tube itself compromises the zone, different materials can be used as alternates. Slow withdrawal of fluid from the exclusion zone typically does not induce much disturbance; however, if any disturbance is noted, the collection rate can be slowed until the disturbance becomes negligibly small, the tradeoff being increased time required for collection.
[0075] To sample from a broader, more representative zone, the tube can be steadily but gently withdrawn parallel to the exclusion surface during collection. Again, it may be important to test in the same way as above whether withdrawal disturbs the exclusion zone, and if necessary, collected samples can be analyzed for microsphere contamination.
[0076] Once the controls confirm the stability of a given implementation, additional controls can be carried out to test the efficacy of sampling. These tests can be carried out on NAFION and polyacrylic acid surfaces exposed to aqueous solutions of small molecular weight dyes. Dyes are ordinarily separated out satisfactorily. It is useful to confirm the absence of dye from drawn samples of different volume. These samples can be compared against standards in a fluorimeter. This helps to establish the size of sample volumes required to avoid contamination in the salt-exclusion processes.
[0077] Next, exclusion of salt can be tested. NaCl concentration can be 100 mM to start. The region of the exclusion zone immediately adjacent to the excluding surface can be sampled first, as this is the region within which salt should be most profoundly excluded. Samples drawn from this region can be tested using osmometry. Next, a micrometer drive can be used to translate the tube to a position ~100 µm more distant from the surface, and samples can again be collected. The protocol can be repeated at 100 µm intervals in order to obtain a profile of [NaCl] vs. distance from the excluding surface. A priori, in one implementation, undetectably low concentrations continue for a distance of several hundred micrometers, followed by a rapid falloff at roughly 0.5 mm from the surface. If increased measurement resolution seems warranted, smaller collection tubes can be used, and spatial increments can be reduced.
[0078] Separation can be implemented at different NaCl concentrations ranging from 1 mM up to 1 M (ordinary seawater is 0.4 M to 0.45 M). If increased detection sensitivity is required for low concentrations, atomic absorption spectrometry can be used instead of osmometry—several atomic absorption spectrometers are satisfactory for use. We have noted a diminution of exclusion-zone size with salt concentration, ~40% reduction as [NaCl] rose from nominally zero to 100 mM; hence, with the addition of salt there is a more rapid falloff of separation efficacy with distance from the excluding surface.
[0079] The separation of salts other than NaCl is possible too, as water often contains a variety of salts other than NaCl, albeit in lower quantity. The exclusion-zone size may be compromised by different salts in different ways; i.e., reduction of exclusion-zone size depends on the salt's position in the Hofmeister series, K+>Na+>Li+>Ca2+. It can be useful to verify these preliminary observations systematically, and then test the efficacy of separation of each one of them. Ideally, they can be separated with much the same efficacy of NaCl; however if these salts compromise the exclusion zone sufficiently, then collection parameters may need to be adjusted.
[0080] Other relevant variables that may be important to test for their ultimate practical value include above all, temperature and pH. The former can be evaluated by using a temperature-controlled stage during salt-separation tests, while the latter can be evaluated by adding HCl or NaOH to vary the pH between 3 and 12 with continuous pH monitoring. The optimum result reveals the absence of any strong dependence of either of these variables on efficacy of separation; however, a noted dependence can be compensated for in the implementation.
[0081] In one implementation, the exemplary technique removes sea-salts from seawater. In one process, Puget Sound seawater (Na+=410 mM) was used, and tests were carried out as above. The goal was Na<+> removal effective enough to reach EPA drinking-water standards (20 mg/l, or around 0.9 mM) (http://www.epa.gov/safewater/ccl/sodium.html).
[0082] In another implementation, the exemplary technique separates bacteria and viruses from the aqueous mixture, for decontamination applications, in much the same way as salt separation was accomplished above.
Detail of Pathogen Separation
[0083] Common bacteria have a size in the micrometer range, some larger; hence, they are detectable by optical microscopy, most clearly using phase or DIC microscopy. Viruses elude practical detection by optical microscopy; hence, they can be labeled with a fluorophore and detected by fluorescence microscopy. Excluding surfaces can be the same as those used above, polyacrylic-acid gels, and NAFION. Similar collection strategies as used above can be used in this application. Various common bacteria and viruses were considered, limited to non-pathogenic varieties such as heat-inactivated samples that require no special facilities. Bacteria include: Escherichia coli (HB101) and Pseudomonas aeruginosa purchasable from American Type Culture Collection (Manassas, Va., USA). Viruses include adenovirus, SV40, and influenza available from Virapur (San Diego, Calif., USA). These can be fluorophore labeled.
[0084] Different implementations may vary the conditions used for removing the pathogens. The pH can be varied from 3 to 12 with NaOH and HCl with continuous pH monitoring, and runs can be carried out at each pH value. Salt concentration can be varied from the low level of pure water, all the way up to molar values. Temperature can be varied too, as described above.
[0085] In the case of bacteria, and unlike salt, because the exclusion zone is visually detectable, the exemplary technique can measure not only the extent of exclusion, but also the rate at which the exclusion zone develops.
[0086] These measurements are performed by abruptly exposing the exclusion surface to a suspension of bacteria, and tracking the time course of exclusion zone development. Such dynamic measurements are important features to bear in mind when a particular exemplary purification system is designed. Another aspect to keep in mind is measurement of separation dynamics during flow in cylindrical tubes (FIG. 10, above).
[0087] Having established the basic exclusionary features, including how much each type of solute is excluded and the magnitudes of the respective exclusion zones, the next step is to exploit those features in an implementation. A basic starting point is the implementation of microsphere separation during flow in cylindrical channels that was discussed above.
[0088] In one implementation, the channels are easily made: the gel is molded to contain a cylindrical glass rod, which is removed once the gel has set. In the case of NAFION, tubular samples with diameter ~0.5 nm can be obtained from the supplier. Because the NAFION wall is thin, visualizing particles or fluorescence within the channel should engender no serious difficulty.
[0089] A syringe pump is used to drive suspensions through the channel. (Improved versions of the pump can eliminate residual pulsations and result in higher precision measurements.) For test purposes, a sample may be placed on a microscope stage, flow is imposed by the pump, and the distribution of microspheres is measured at different times at a single location, and at different positions along the channel. Such tests reveal the time- and distance-dependence of exclusion prior to manufacture of the implementation.
[0090] Measurements such as those just described can be carried out on different solutes. Knowing the size of the exclusion zone in static situations (FIGS. 6-9) will shortcut the number of trials (e.g., flow rate, channel diameter and length, etc.) required to establish reasonable parameters such as flow rate for separation of salt, as well as for separation of pathogens.
[0091] For effective exclusion, different solutes may require different physical and geometric exclusion parameters. However, it may turn out that a particular set of parameters is acceptable for the exclusion not only of salt(s), but also of a range of pathogenic substances. In such a case, it may be possible to remove all of these in a single filtration pass, without requiring multiple stages. FIG. 12 shows a system for collecting purified water, i.e., a fixture designed to collect effluent from a gel separation channel. The collection system is designed to interface with the exit of the gel-separation unit; in FIG. 10, it corresponds to the collection zone 1008 on the right. The design in FIG. 12 involves a double cylinder, for collection of annular (solute-free) and core (solute-containing) flows; similar to that of FIG. 10. An initial design of the unit in FIG. 12 can be made using thin-walled stainless steel tubing. The interface end of the apparatus may be inserted into the end of the gel or NAFION channel. The inner tube or “waste outlet” is designed to catch the solute-containing fluid, and is connected to an exit tube, which either discards the fluid, or saves it for recycling. The annular ring between the inner and outer tube extracts the purified water, which flows out through a side-exit port for collection.
[0092] For both fractions, pumps may be useful to facilitate more rapid flow. Dimensions and materials for effective water collection devices may be optimized. The size of the inner cylinder is sometimes critical in ensuring that the maximum quantity of salt or impurity is removed. This follows for two reasons: (i) the salt-containing zone of the separator may need to project entirely within the collector's inner cylinder; and, (ii) the exclusion zone might not exclude uniformly, so that, for example, regions at low radius just beyond the salt-containing zone may still contain some amounts of salt whereas regions at larger radius may be truly salt free. Cylinder diameter can be carefully tested for each solute of interest. Thus, using a set “standard” for gel-channel conditions, collection ducts with a series of internal diameters can be tested to check for optimum efficacy.
[0093] It is also useful to check a series of materials other than stainless steel, including various nonreactive metals and polymers, as it is not clear a priori whether a hydrophilic or hydrophobic material will result in optimum collection. Water must flow freely into the tube; yet it should not stick excessively to the tube's walls. Hence some combination of hydrophilic and hydrophobic properties may be necessary to optimize the ability to collect. One important consideration can be the collection speed in the absence of vacuum pumping. This can be important in an effort to make the system independent of the need for external power.
Optimizing an Exemplary System
[0094] If drinking water is to be filtered from pathogenic substances, then testing should be done on ordinary drinking water to which pathogens have been added. If purification turns out not to be adequate in these situations, then backtracking can obtain adequate purification, e.g., by adding one solute at a time to pure water to determine which may be the “offending” agent.
[0095] Testing can also achieve the optimum excluding material. Polyacrylic acid gels and NAFION are good candidates, because they produce abundant exclusion. However, these surfaces are not necessarily optimal for all solutes, and there are countless other materials that can be customized for various solutes. In particular, gels and polymers studied thus far have been neutral (polyvinyl alcohol) or negatively charged (e.g., polyacrylic acid). The one positively charged surface (aminated styrene-DVB-copolymer) explored briefly gave positive results. Hence, in some cases positively charged gels (e.g., chitosan) may exclude both pathogenic substances and salt. In such a case, systematic studies including pH dependence can be carried out for optimizing the excluding material. In some instances, complementarity exists between negatively charged and positively charged surfaces, and the most effective separation may include one layer of each, or some spatial surface arrangement of positively and negatively charged regions.
[0096] Surfaces to be utilized may include functionalized monolayers (SAMS). Monolayer results obtained with exposed carboxyl groups showed ample exclusion of carboxylate microspheres. The ability to functionalize surfaces opens many possibilities in terms of ultimate manufacture.
[0097] In one implementation, the system is as independent of external electrical power as possible. It is also beneficial to balance purification efficacy with rapid throughput. Rapid throughput implies diminishing drag during flow through narrow channels. In one implementation, the friction in tubes lined with certain block co-polymers is massively diminished—by as much as three orders of magnitude (Raviv et al., 2003). If these polymers, e.g., PMMA-PSGMA, are also found to create exclusion zones for a given solute, then it is possible to achieve reasonable solute separation, while at the same time achieving substantially enhanced throughput as a result of lowered resistance—driven only by the force of gravity. In that situation, the system can operate much like a household water filter, with simple gravity-driven flow.
[0098] In one implementation, an exemplary apparatus is created through microfabrication. If the optimum channel size is in the range of hundreds of microns or less, then microfabrication can create arrays of channels. An example is shown in FIG. 13. The top of FIG. 13 is oriented upward, and the rectangles represent the excluding surfaces. The unpurified water enters at the top, and as it proceeds downward, the exclusion zone grows.
[0099] The contaminated water (stippled) exits at the bottom through a connecting channel. The purified water (clear) enters a collecting duct (broad “U” in diagram). Because identical, slab-like units are stacked upon one another, the U-shaped ducts create channels oriented normal to the plane of the diagram. Purified water is collected at the ends of those channels. Slight tilt out of the plane of the paper can bias the flow in one or the other direction, facilitating collection.
[0100] The exemplary array of FIG. 13 can operate purely by gravitational force or by pumps to facilitate flow.
Exemplary Methods
[0101] FIG. 14 shows a representative exemplary method 1400 of separating components of aqueous mixtures. In the flow diagram, the operations are summarized in individual blocks. The exemplary method 1400 may be performed by hardware, such as the exemplary differential extractor 100.
[0102] At block 1402, an aqueous mixture (suspension, solution, etc.), is flowed over a hydrophilic surface, i.e., an exclusion surface, or in some cases a hydrophobic surface. Example materials for such an exclusion surface are certain gels, polymers; NAFION, etc.
[0103] At block 1404, purified water can be collected in a first region near the hydrophilic surface. The exemplary differential extractor 100 may have an annular tube that lifts only the purified water.
[0104] At block 1404, one or more concentrated non-aqueous components of the aqueous mixture may be collected in a second region beyond the first region of the purified water, with respect to the exclusion surface. The exemplary differential extractor 100 may have a center or core tube that draws the concentrated non-aqueous components from the apparatus.
Alternative Implementation
[0105] In an alternate implementation, it has been found that solutes were excluded from a region just below the top surface of water, at the air-water interface. With a chamber (or tank) made from two large flat pieces of glass separated by 3 mm, a microsphere suspension was added, and the chamber was viewed facing one of the glass pieces. The zone just beneath the surface began to clear. Within 30 minutes a 2-mm zone (herein referred to as an exclusion zone) was fully devoid of microspheres. The exclusion zone remained devoid of microspheres for many hours. This was not the result of microsphere settling, which took place at approximately 24 hours after filling the chamber.
[0106] Other implementations to create water separation in an aqueous solution are described in an article titled “Cylindrical phase separation in colloidal suspensions,” by Kate Ovchinnikova and Gerald H. Pollack (accepted for publication in Physical Review E by the American Physical Society, January, 2009), which is hereby incorporated by reference.
[0107] An example diagram 150 of a tank 151 including an aqueous solution with an air layer, a meniscus layer, and bulk water, which may contain microspheres and is thus labeled “water+microspheres.” The clear zone, corresponds to the exclusion zone 152 is shown in FIG. 15. The exclusion zone 152 has characteristics similar to the exclusion zones described above. When the aqueous solution contains microsphere markers, not only does the zone 152 exclude those microspheres, but also its upper region has negative potential, much like exclusion zones. Further the solution remains at constant width even as the upper surface of water is lifted and moved from side to side with a vertically oriented charged rod. Hence, this zone 152 is mechanically cohesive, much like exclusion zones.
[0108] The tank 151 may be used for establishing a volume of an aqueous mixture having a surface. In addition an apparatus collects water at the surface of an aqueous mixture. The apparatus may establish an exclusion zone 152 with a depth in the aqueous mixture. In one implementation, the apparatus may collect water at the surface when the depth of the aqueous mixture is greater than approximately four times the depth of the exclusion zone 152, although any depth may be suitable provided the depth of the aqueous mixture is greater than the depth of the exclusion zone. The aqueous mixture may include a mixture of water, particles and solutes and includes particles and solutes whose removal is desired. In one implementation the depth of the exclusion zone 152 is about 2 mm.
[0109] A collection apparatus including a tube may collect water and transfer the collected water from a tank 151 to a collecting chamber. The collection apparatus may stop collecting when the water in the exclusion zone 152 has been fully transferred from the tank 151 to the collecting chamber. An apparatus may also be provided to admit more mixture to the tank 151 to let the exclusion zone 152 build for later collection.
[0110] In another implementation a skimming apparatus (as generally known) that includes the tube may continuously skim the exclusion-zone water on the surface of the aqueous solution or aqueous mixture. A controller to the skimmer may be provided to adjust the collection rate from the tank 151 to a collection chamber so that a rate of buildup of water in the exclusion zone 152 and collection of water reach a steady state.
[0111] The presence of a solute-exclusion zone at the upper surface of water provides an environment in which water can be skimmed off to provide purified water.
[0112] In one flow embodiment, a tank's 151 upper zone is connected through a downward slanted tube to a lower collecting chamber. A valve opens periodically to allow flow from tank 151 to collecting chamber to occur. The tank 151 is then replenished with the aqueous solution.
[0113] In another embodiment, an upper zone in tank 151 is set up similar to the flow embodiment except that a pump is used to facilitate withdrawal of the top layer.
[0114] In another embodiment, the upper zone of the tank 151 is set up similar to the flow embodiment except that multiple stages are used to achieve further purification.