Huifang XU
PiezoElectroChemical Effect
PiezoElectroChemical Effect
Scavenging
energy waste to turn water into hydrogen fuel
by Jill Sakai
by Jill Sakai
Abstract: Materials scientists at the University of Wisconsin-Madison have designed a way to harvest small amounts of waste energy and harness them to turn water into usable hydrogen fuel. The process is simple, efficient and recycles otherwise-wasted energy into a usable form.
"This study provides a simple and cost-effective technology for direct water splitting that may generate hydrogen fuels by scavenging energy wastes such as noise or stray vibrations from the environment," the authors write in a new paper, published March 2 in the Journal of Physical Chemistry Letters. "This new discovery may have potential implications in solving the challenging energy and environmental issues that we are facing today and in the future."
The researchers, led by UW-Madison geologist and crystal specialist Huifang Xu, grew nanocrystals of two common crystals, zinc oxide and barium titanate, and placed them in water. When pulsed with ultrasonic vibrations, the nanofibers flexed and catalyzed a chemical reaction to split the water molecules into hydrogen and oxygen. UW-Madison Mechanical Engineering Professor Xiaochun Li lent theoretical and experimental expertise to the ultrasonic vibrations part of the research.
When the fibers bend, asymmetries in their crystal structures generate positive and negative charges and create an electrical potential. This phenomenon, called the piezoelectric effect, has been well known in certain crystals for more than a century and is the driving force behind quartz clocks and other applications.
Xu, who is part of the Materials Science Program administered through the UW-Madison College of Engineering, and his colleagues applied the same idea to the nanocrystal fibers. "The bulk materials are brittle, but at the nanoscale they are flexible," Xu says, like the difference between fiberglass and a pane of glass.
Smaller fibers bend more easily than larger crystals and therefore also produce electric charges easily. So far, the researchers have achieved an impressive 18 percent efficiency with the nanocrystals, higher than most experimental energy sources.
In addition, Xu says, "because we can tune the fiber and plate sizes, we can use even small amounts of [mechanical] noise — like a vibration or water flowing to bend the fibers and plates. With this kind of technology, we can scavenge energy waste and convert it into useful chemical energy."
Rather than harvest this electrical energy directly, the scientists took a novel approach and used the energy to break the chemical bonds in water and produce oxygen and hydrogen gas.
"This is a new phenomenon, converting mechanical energy directly to chemical energy," Xu says, calling it a piezoelectrochemical (PZEC) effect.
The chemical energy of hydrogen fuel is more stable than the electric charge, he explains. It is relatively easy to store and will not lose potency over time.
With the right technology, Xu envisions this method being useful for generating small amounts of power from a multitude of small sources — for example, walking could charge a cell phone or music player and breezes could power streetlights.
"We have limited areas to collect large energy differences, like a waterfall or a big dam," he says. "But we have lots of places with small energies. If we can harvest that energy, it would be tremendous."
The new paper is co-authored by UW-Madison graduate student Kuang-Sheng Hong and research scientist Hiromi Konishi, who were co-supported by Li.
Xu's research is supported by grants from the UW-Madison Graduate School, National Science Foundation, NASA Astrobiology Institute and the U.S. Department of Energy.
http://www.greencarcongress.com/2010/03/pzec-20100316.html
GreenCarCongress.com
16 March 2010
Researchers
Show New Piezeoelectrochemical Effect Can Scavenge Energy
Wastes Such as Noise or Vibration to Generate Hydrogen Via
Water Splitting
H2 and O2 are produced by deforming a ZnO fiber or BaTiO3 dendrite in water via oxidation-reduction reactions. Credit: ACS, Hong et al. Click to enlarge.
Materials scientists at the University of Wisconsin-Madison have discovered a phenomenon—the direct conversion of mechanical energy to chemical energy—which they termed the piezoelectrochemical (PZEC) effect. They then applied the PZEC effect to generate hydrogen and oxygen via direct water splitting.
Their study, they write in a paper published online 2 March in ACS’ Journal of Physical Chemistry Letters, provides a simple and cost-effective technology that may generate hydrogen fuels by scavenging energy wastes such as noise or stray vibrations from the environment.
The mechanism of the water decomposition via the PZEC effect relies on the piezoelectric properties of the materials. Although the piezoelectric effect has been known for over 100 years and has been demonstrated in many fields, little work has been done to address its application in wet conditions (such as in solution) and particularly in the direct conversion of mechanical energy to chemical energy.
"...conditions. In this study, we use microfibers of ZnO and dendritic BaTiO3 to initiate a phenomenon and drive a nonspontaneous redox reaction, the formation of H2 and O2 gases from water, by using mechanical energy. Here, we show the capabilities of these materials for scavenging energy waste from the environment, such as noise and vibration, to generate hydrogen and oxygen gases."
—Hong et al.
“We have limited areas to collect large energy differences, like a waterfall or a big dam. But we have lots of places with small energies. If we can harvest that energy, it would be tremendous.”
—Huifang Xu
The researchers, led by UW-Madison geologist and crystal specialist Huifang Xu, grew nanocrystals of two common crystals, zinc oxide and barium titanate, and placed them in water. When pulsed with ultrasonic vibrations, the nanofibers flexed and catalyzed a chemical reaction to split the water molecules into hydrogen and oxygen.
When the fibers bend, asymmetries in their crystal structures generate positive and negative charges and create an electrical potential. Smaller fibers bend more easily than larger crystals and therefore also produce electric charges easily. So far, the researchers have achieved an 18% efficiency with the nanocrystals, higher than most experimental energy sources.
"The physics and chemistry of generating hydrogen and oxygen gases from pure water arise from the combination of piezoelectric properties of ZnO fibers and BaTiO3 dendrites and the redox reaction of water. Both ZnO and BaTiO3 are well-characterized piezoelectric materials...Specific morphological aspects of ZnO and BaTiO3 such as fibers and dendrites will acquire electric potentials on their surfaces if an external mechanical energy is applied that results in a bending (deformation) of the fibers or dendrites. The strain induced electric potential formed on the fiber or dendritic surface in wet conditions (i.e., in pure water) is available for the reduction and oxidation reaction via charge transfer to species such as water molecules adsorbed on the surface.
"Note that the developed potential must be greater than the standard redox potential of water (1.23 eV) to make electrons available to initiate the redox reaction in this experiment. Residual charges or potentials lower than 1.23 eV will not participate in reactions to form H2 and O2 from water." — Hong et al.
In addition, they noted, in the PZEC effect, the catalyst—i.e., the zinc oxide and barium titanate—participated in the direct water splitting reaction by donating strain-induced electrons and holes without being oxidized, reduced, or decomposed. TEM and XRD observations showed that no metal species or other extra phases appeared in our experiment samples before and after the reactions.
Because the fiber and plate sizes can be tuned, said Xu, even small amounts of mechanical noise—such as a vibration or water flowing—could bend the fibers and plates. With the right technology, Xu envisions this method being useful for generating small amounts of power from a multitude of small sources—for example, walking could charge a cell phone or music player and breezes could power streetlights.
"Using fibrous ZnO and dendritic BaTiO3 catalysts with piezoelectric properties, we have demonstrated the PZEC effect for generating H2 and O2 from water. We have successfully verified a direct conversion of mechanical energy to chemical energy. Finding an optimum fiber length and introducing the resonance frequency of ZnO and BaTiO3 for the direct water splitting process, it may be possible to obtain a much greater H2 and O2 production rate.
"Utilizing the piezoelectric fibrous samples, the phenomena demonstrated could usher in a new era in the field of recycling environmental energy wastes. Vibrational energy waste generated in the environment from noise, wind power, running water, or water wave action can be scavenged or harvested as a driving force for direct water splitting, thereby forming H2 and O2 by means of PZEC fiber arrays implanted on a substrate. The fiber arrays can also be used to harvest artificial energy wastes such as traffic noise and vibrations and convert them into hydrogen and other chemical energies.
"The principle of the PZEC effect using these fibers could be a very important step forward in nanotechnology that recycles the energy wastes from the environment into precious alternative chemical energy. This work will open a new field of study on hydrogen generation, redox reactions, and energy recycling." —Hong et al.
The new paper is co-authored by graduate student Kuang-Sheng Hong, research scientist Hiromi Konishi and mechanical engineering professor Xiaochun Li, all at UW-Madison. Xu’s research is supported by grants from the UW-Madison Graduate School, National Science Foundation, NASA Astrobiology Institute and the US Department of Energy.
Resources
Kuang-Sheng Hong, Huifang Xu, Hiromi Konishi and Xiaochun Li (2010) Direct Water Splitting Through Vibrating Piezoelectric Microfibers in Water. J. Phys. Chem. Lett., Article ASAP doi: 10.1021/jz100027t
http://www.newscientist.com/article/dn18661-crystals--sound--water--clean-hydrogen-fuel.html?full=true&print=true
Journal of Physical Chemistry Letters
DOI: 10.1021/jz100027t
16 March 2010
Crystals +
sound + water = clean hydrogen fuel
by
Phil McKenna
by
Phil McKenna
Every drop of water is stuffed with the greenest of fuels, hydrogen, but getting it out is a challenge. A new material raises the prospect of doing so using noise pollution – from major roads, for example.
A team at the University of Wisconsin-Madison made crystals of zinc oxide that, when immersed in water, absorb vibrations and develop areas of strong negative and positive charge. These charges rip apart nearby water molecules, releasing hydrogen and oxygen gas.
"This is like a free lunch," says lead researcher Huifang Xu. "You are getting energy from the environment just like solar cells capture energy from the sun."
Underwater operator
Xu and colleagues generate hydrogen using a new variation on piezoelectric crystals – materials that generate a voltage when strained and which are being investigated as a way to generate electricity from movement.
The new crystals, however, are designed to be submerged, so the charge they generate instead pulls apart water molecules to release hydrogen and oxygen gas, a mechanism Xu's team calls the piezoelectrochemical effect.
Xu and colleagues grew thin microfibers of highly flexible zinc oxide crystals that flex when subjected to vibration, for example due to sound waves. They showed that ultrasonic vibrations under water cause the fibres to bend between 5 and 10 degrees at each end, creating an electrical field with a high enough voltage to split water and release oxygen and hydrogen.
Growing fibres with different dimensions changes the type of vibration they absorb best. For instance, it should be possible to tune them to maximise energy production from the vibrations caused by water flowing past or any other sound, say Xu.
Efficiency issue
Xu says that lab tests suggested the material can convert 18 per cent of the energy it absorbs from vibration into energy locked up in hydrogen gas, which can be released by burning.
Conventional piezoelectric materials are not as efficient at converting vibrations into electricity, and typically achieve around a 10 percent conversion rate. Using the charge a material generates indirectly, to split water, instead of directly to drive current, accounts for the difference, says Xu. The new materials could be used to develop systems that generate hydrogen from the noise of anything from machinery to crashing waves, he adds.
"It's a good idea," says Jinhui Song of Georgia Tech University, Atlanta. Because there is no need to create a circuit, devices based on the new crystals could be simpler than those based on conventional dry piezoelectrics, he points out. "They can reduce the complexity of the device."
However, he's sceptical that the wet devices should necessarily be more efficient. In principle, says Song, the energy generated by a material should be the same however it is deployed.
US2010012479
Mechanism for Direct-Water-Splitting Via Piezoelectrochemical Effect
Mechanism for Direct-Water-Splitting Via Piezoelectrochemical Effect
Abstract -- A mechanism of initiating a redox reaction, such as hydrogen gas production by direct-water-splitting, is provided in which a piezoelectric material is mechanically stressed by actively applying a mechanical stress to the material. The mechanical stress applied to the piezoelectric material causes an electrical potential build up on the surface of the material due to the piezoelectric properties of the material. When the piezoelectric material stressed in this manner is placed in direct contact with the redox reaction reactant(s), the potential on the polarized surface can be used as chemical driving energy to initiate the reaction, such as to split water and generate hydrogen gas. In this manner the mechanical energy applied to the piezoelectric material, such as vibration energy from natural or man-made sources, can be converted directly into chemical energy to initiate the reaction.
Inventors: Xu; Huifang; (Madison, WI) ; Hong; Kuang-Sheng; (Madison, WI) ; Li; Xiaochun; (Madison, WI)
U.S. Current Class: 204/164; 310/339; 422/186.04
U.S. Class at Publication: 204/164; 310/339; 422/186.04
Intern'l Class: C01B 3/02 20060101 C01B003/02; H02N 2/18 20060101 H02N002/18; B01J 19/08 20060101 B01J019/08
Description
FIELD OF THE INVENTION
[0003] The present invention relates to oxidation/reduction reactions, and more specifically to directly initiating these types of reactions utilizing a mechanical mechanism.
BACKGROUND OF THE INVENTION
[0004] As the world today rapidly increases its demand of the fuels, energy shortage becomes one of the most challenging issues the human being is facing. Fossil fuels, which currently contribute more than 85% of the world's energy supply, are expected to be depleted in the following 30.about.50 years. In addition, it is extensively believed that burning the fossil fuels is the major cause for global-warming and long term climate change leading to natural disasters, further pressing on the need for reductions in fossil fuel usage.
[0005] These possible near-future environmental disasters have attracted people's attention and resulted in a vast and growing interest in development of alternative renewable energy resources. Among the studies that have been done, hydrogen energy is considered as an alternative to fossils fuels as a source of energy, and is expected to have enormous growth potential as a result of recent advances in technology. Hydrogen is renewable, very flexible in conversion to other forms of energy, and no air pollutants or green house gases are produced from the combustion of hydrogen. In an idealistic, long-term vision, a hydrogen/electricity interchangeable energy source can provide power for all aspects of the energy economy such as transportation, industrial, and residential usage.
[0006] Traditionally, hydrogen gases are produced primarily via the processes of steam reforming methane and electrolysis of water. The former produces CO.sub.2 (a green house gas) that is released into the atmosphere, while the later uses electricity generated from fossil fuels.
[0007] In recent years, the alternative production method of using solar energy to produce hydrogen has triggered great interest. Specifically, photocatalytic water splitting using oxide semiconductors under irradiation has received great attention. A tremendous amount of research articles have recently been published on the topic, such as concerning the use of a titania-based photocatalyst, which is the most common material for hydrogen production, in photovoltaic cells, as well as in environmental decontamination. Thousands of studies are ongoing concerning improving the performance of this and other photocatalysts in two main areas: 1) quantum efficiency, such as oxide-doping and metals additions; and 2) solar efficiency, including anion doping, and physically/chemically implanting the transition metals in the photocatalyst. Yet, all the research currently being done contains many limitations and drawbacks including the small number of available photocatalysts, their limited efficiency, cost, and device life-time, which still remain unsolved up to this point.
[0008] As a result, it is highly desirable to develop a mature and commercially available technology for hydrogen production that can be put directly into application in daily usage.
SUMMARY OF THE INVENTION
[0009] According to one aspect of the present invention, a novel method of hydrogen production is provided that employs direct water-splitting. Instead of utilizing existing semiconductor materials (i.e., TiO.sub.2-based materials), and the limitation of sun harvesting to generate hydrogen from these materials, the present invention involves the direct conversion of mechanical energy into chemical energy for splitting water and forming hydrogen and oxygen gases. The mechanism for this conversion is a novel phenomenon, i.e., the direct conversion of mechanical energy to chemical energy, which is termed the Piezoelectrochemical (PZEC) Effect. The mechanism of the water decomposition via PZEC effect relies upon the piezoelectric properties of the materials utilized in the process. Although the piezoelectric effect has been known for over one hundred years and has been demonstrated in many fields, little work has been done to address its application in wet conditions, such as in solution, and particularly in the direct conversion of mechanical energy to chemical energy.
[0010] More specifically, certain piezoelectric materials, including but not limited to .alpha.-quartz (SiO.sub.2), ZnO, or BaTiO.sub.3, among others, have unique piezoelectric properties where the piezoelectricity is an intrinsic property of the material, such that no physical/chemical doping (cations or anions), chemical additives (including transition metals) or any forms of implantation are needed to create these properties. In addition, one of the materials having these properties, i.e., quartz, is also one of the most abundant minerals on the Earth's surface (i.e. beach sands). As a result, by using quartz as a material in the process, the hydrogen production via direct-water-splitting can be achieved at a low cost, and, because quartz is a natural material that is environmental friendly, no pollution issues are created by the process.
[0011] When a mechanical force is applied to materials having these properties, the materials generate an electrical response in the form of positive and negative charges being generated at the surface of the material. This electrical charge can then interact with the surrounding the chemical species in the environment surrounding the material, which can take various forms in the present invention, such as an aqueous environment. This interaction takes the form of catalyzing an oxidation/reduction reaction, such as a water-splitting reaction with the water molecules in the aqueous environment in which the mechanically-stressed piezoelectric material is placed.
[0012] According to another aspect of the present invention, the mechanical stress applied to the piezoelectric material to generate the electrical response can be supplied from any of a number of potential sources of mechanical force, such as the forces exerted on a roadway or walkway over which cars and pedestrians are passing, or the force generated by sound waves striking a surface, among others.
[0013] According to still another aspect of the present invention, the piezoelectric material can take various forms depending upon the particular environment and/or mechanical force supply with which the material is to be utilized. The piezoelectric material can be formed as fibers of various configurations, lengths and/or thicknesses that are optimized for the mechanical force supply for the piezoelectric material. Also, a support for the piezoelectric materials can be formed to maximize the exposure of the materials to the chemical species in the environment surrounding the material.
[0014] Numerous other aspects, features and advantages of the present invention will be made apparent from the following detailed description taken together with the drawing figures.
BRIEF DESCRIPTION OF THE DRAWINGS
[0015] The drawing figures illustrate the best mode currently contemplated of practicing the present invention.
[0016] In the drawings:
[0017] FIG. 1 is a schematic view of .alpha.-quartz along the c-axis;

[0018] FIGS. 2A-2C are schematic views of quartz molecules in the unstrained, longitudinally strained and shear strained states;

[0019] FIG. 3 is a schematic view of the Perovskite structure of PZT;

[0020] FIG. 4 is a graph of a hysteresis loop for a poled piezoelectric ceramic material;

[0021] FIG. 5 is a graph of a butterfly loop of a piezoelectric ceramic material;

[0022] FIG. 6 is a schematic view of a piezoelectric and ferroelectric ceramic material in an unpoled state;

[0023] FIG. 7 is a schematic view of a piezoelectric and ferroelectric ceramic material in a poled state;

[0024] FIG. 8 is a schematic view illustrating the location and direction of reference axis used in determining strain and electrical displacement in piezoelectric materials;

[0025] FIG. 9 is a graph of hydrogen production from quartz in water under UV irradiated and non-irradiated conditions;

[0026] FIG. 10 is a graph of hydrogen production from various materials in water under UV irradiated conditions;

[0027] FIG. 11 is an X-ray diffraction pattern of anatase titanium dioxide;

[0028] FIGS. 12A-12B are schematic views of .alpha.-quartz and .beta.-quartz along the c-axis;

[0029] FIG. 13 is a schematic view of a hexagonal spiral .beta.-quartz structure;

[0030] FIG. 14 is a schematic view of a Dauphine twin boundary in low quartz;

[0031] FIG. 15 is an X-ray diffraction pattern of ball-milled quartz;

[0032] FIGS. 16A-16B are photomicrographs of quartz grains;

[0033] FIG. 17 is a graph of hydrogen production by zinc oxide in water under non-irradiated conditions;

[0034] FIG. 18 is a graph of the spectra of various quartz powders;

[0035] FIGS. 19A-19F are schematic views of the geometry and bending of piezoelectric material fibers;


[0037] FIG. 21 is an Eh-pH diagram showing the stability field of water

[0038] FIG. 22 is a photomicrograph of nanoscale quartz fibers;

[0039] FIG. 23 is a graph of hydrogen production from zinc oxide fibers in water that is subjected to ultrasonic vibrations;

[0040] FIG. 24 is an SEM image of BaTiO.sub.3 dendrites grown on glass substrate;

[0041] FIG. 25 is an TEM image of BaTiO.sub.3 dendrites grown on glass substrate;
[0042] FIG. 26 is an HRTEM image of one BaTiO.sub.3 crystal in the dendrite showing (001) and (110) lattice fringes;
[0043] FIG. 27 is an SEM image showing the typical morphology and crystal direction of ZnO fibers grown on Si (100) wafer, in which the ZnO fibers were elongated along c-axis with diameter around 0.4 .mu.m;
[0044] FIG. 28 is an TEM image showing the typical morphology and crystal direction of ZnO fibers grown on Si (100) wafer, in which the ZnO fibers were elongated along c-axis with diameter around 0.4 .mu.m;
[0045] FIG. 29 is a schematic diagram showing shapes of a single ZnO fiber (upper) and BaTiO.sub.3 dendrite (lower).
[0046] FIG. 30 is a graph illustrating the evolution of H.sub.2 as a function of time showing performance of as-synthesized ZnO fibers on Si (100) wafer (1.times.1 cm.sup.2) in water responding to ultrasonic waves;

[0047] FIG. 31 is a graph illustrating the evolution of O.sub.2 as a function of time showing performance of as-synthesized ZnO fibers on Si (100) wafer (1.times.1 cm.sup.2) in water responding to ultrasonic waves;

[0048] FIG. 32 is a graph illustrating the evolution of H.sub.2 performance of as-synthesized

[0049] FIG. 33 is a graph of the hydrogen evolution of the ZnO fibers under standard condition with various average fiber lengths: (I) control or no fiber, (II) 5.7 .mu.m, (III) 6.3 .mu.m, (IV) 7.3 .mu.m, and (V) 7.8 .mu.m; and

[0050] FIG. 34 is a graph illustrating the efficiency of the piezoelectrochemical effect for converting mechanical energy into chemical energy as a function of ZnO fiber length.

[0051] With reference now to the drawing figures in which like reference numerals designate like parts throughout the disclosure, the present invention is a method and apparatus for converting mechanical energy applied to piezoelectric materials into chemical energy for the formation of hydrogen for use as an alternative energy source. This is accomplished by positioning a number of fibers of a piezoelectric material within an aqueous environment and applying the mechanical force to the piezoelectric fibers to initiate a water-splitting reaction at the surface of each piezoelectric fiber, thereby producing hydrogen.
[0052] Electrochemistry of Direct-Water-Splitting
[0053] In an electrochemical cell, electrons flowing from the anode to the cathode are driven by electromotive force (emf), which is produced by the difference in electrical potential energy between the two electrodes. The quantity of the electrical work produced is defined as a function of potential energy difference and the number of electrons:
Electrical work=Number of Electrons*Potential Energy Difference
Note that the charge on a single electron is 1.6022.times.10.sup.-19 C, where the coulomb (C) is defined as a 1 ampere flow for 1 second. The emf of an electrochemical cell (or commonly named cell voltage), indicates the amount of work a cell can produce for each coulomb of charge that the chemical reaction produces. The standard cell voltage (E.sup.o) is measured under standard conditions, in which all reactants and products must be present as a pure form at 1 bar pressure or 1 M concentration. The cell voltage of any reaction is obtained by using the standard voltages of the half-reactions that occur at the cathode and anode:
E.sup.0.sub.cell=E.sup.0.sub.cathode-E.sup.0.sub.anode
By definition, the standard hydrogen electrode, in which hydrogen gas at 1 bar pressure is bubbled over a platinum electrode immersed in aqueous acid solution, with an activity of hydrogen ions of 1 at 25.degree. C. is assigned the value of 0 V:
2H.sub.3O.sup.+(aq, 1M)+2e.sup.-.fwdarw.H.sub.2 (g, 1 bar)+2H.sub.2O(1) E.sup.o=0.0 V
Thus, all other standard electrode potentials are measured in values relative to the standard hydrogen electrode. Some additional redox potentials are listed in Table 1 for comparison.
TABLE-US-00001 TABLE 1 Standard reduction potentials in aqueous solution at 25.degree. C. Reduction Half-Reaction E.degree. (V) F.sub.2(g) + 2e.sup.- .fwdarw. 2F.sup.-(aq) +2.87 Au.sup.3+(aq) + 3e.sup.- .fwdarw. Au(s) +1.50 Fe.sup.3+(aq) + e.sup.- .fwdarw. Fe.sup.2+(aq) +0.771 O.sub.2(g) + 4H.sub.3O.sup.+(aq) + 3e.sup.- .fwdarw. 6H.sub.2O(l) +1.229 2H.sub.3O.sup.+(aq) + 2e.sup.- .fwdarw. H.sub.2(g) + 2H.sub.2O(l) 0.00 PbSO.sub.4(s) + 2e.sup.- .fwdarw. Pb(s) + SO.sub.4.sup.2-(aq) -0.356 Fe.sup.2+(aq) + 2e.sup.- .fwdarw. Fe(s) -0.44 Zn.sup.2+(aq) + 2e- .fwdarw. Zn(s) -0.763 Li.sup.+(aq) + e.sup.- .fwdarw. Li(s) -3.045
[0054] From Table 1 it is found that the reduction half-reaction of water at the cathode is defined as 0.0V, while the oxidation half-reaction of water to oxygen requires 1.229V of 20 potential. Thus, the overall reaction requires 1.229 V (1.229-0=1.229V) of chemical potential energy. As a result, the Gibbs free energy of splitting water into hydrogen and oxygen under a standard condition can be expressed as:
.DELTA.G.sup.0=-nFE.sup.0.sub.cell
=237.141 kJ/mol
where n=number of moles, and F=Faraday constant=9.6485.times.10.sup.4 C/mol. Therefore, the threshold energy can be described:
E t = .DELTA. G 0 ( H 2 O ) 2 N A = 1.23 eV ##EQU00001##
where N.sub.A=Avogadro's number=6.02.times.10
[0055] Introduction of Quartz
[0056] Quartz or .alpha.-quartz is a well known mineral form of SiO.sub.2 that is stable below 573.degree. C. at low pressure. Quartz is usually found in sedimentary, igneous, metamorphic, and hydrothermal mineral environments, particularly in continental regions. However, quartz rarely forms in oceanic rocks. Quartz has both piezoelectric and pyroelectric properties, and it contains very limited amount of impurity in substitution. The polymorphs of quartz include .beta.-quartz, tridymite, cristobalite, coesite, stishovite, moganite, and keatite.
[0057] Quartz is usually colorless and the luster is vitreous. Many other colored varieties, however, have been described including citrine (yellow), smoky quartz (gray), amethyst (purple), and rose quartz (pink). There is no cleavage on quartz, which thus reveals its conchoidal fracture. The hardness of quartz is seven (7) with the density of 2.67 g/cm.sup.3. Optically, quartz is uniaxially positive with a maximal birefringence of 0.0095. Table 2 below shows some physical constants of quartz.
TABLE-US-00002 TABLE 2 General physical properties of quartz Chemical Formula SiO.sub.2 Optical Properties Uniaxial positive N.omega. = 1.5443 N.epsilon. = 1.5538 Cleavage None Common crystal forms Prism {1010} Pyramids {1011} and {0111} Luster Vitreous Color, Opacity Transparent, colorless Also gray (smoky quartz), blue, purple (amethyst), yellow (citrine), pink (rose quartz) Hardness 7
[0058] The structure of quartz consists of SiO.sub.4 tetrahedrals with corner-sharing. In other words, each Si is bonded to four oxygen, and each oxygen is connected with two Si. This structure forms an open three-dimensional (3D) framework (framework silicate). Quartz usually refers to the stable form .alpha.-quartz at atmospheric temperature and pressure. .alpha.-quartz is less dense then the high pressure forms coesits and stishovite; whereas it is denser than tridymite and cristobalite, which are the high temperature polymorphs of quartz. Low temperature a-quartz with trigonal symmetry will reversibly transfer to hexagonal .beta.-quartz above 537.degree. C. Crystallographic data and structure for quartz are illustrated in Table 3, Table 4, and FIG. 1. Note that the space groups are P3.sub.121 for right handed and P3.sub.221 for left handed.
TABLE-US-00003 TABLE 3 Crystallographic data of quartz [23] Crystal System Trigonal Point Group 32 Space Group P3.sub.121 or P3.sub.221 Unit Cell Parameters a 4.1937 .ANG. c 5.4047 .ANG. Z (No. of Formula Units per Cell) 3 Density (calculated) 2.648 g/cm.sup.3 Density (measured) 2.65 g/cm.sup.3
TABLE-US-00004 TABLE 4 Atom Coordinate of quartz [24] Atom x/a y/b z/c Si 0.4697 0 0 O 0.4133 0.2672 0.1188
[0059] Piezoelectric Effect of Quartz
[0060] The piezoelectricity of quartz was found by Pierre and Jacques Curie in 1880, when they observed that a pressure exerted on a small piece of quartz caused an electrical potential between deformed surfaces, and that application of a voltage effected physical displacements. The piezoelectric property of quartz is caused as the result a pressure applied to the quartz, which deforms the crystal lattice and causes a separation of the centers gravity of the positive and negative charges. As a result, a non-zero dipole moment is found in each molecule. Assuming a quartz electrode has been short-circuited and stress is applied, free negative charges will be drawn toward the electrode in the direction of positive charge separation, and the free positive charges will move in the opposite direction. When the stress is released, the charges will flow back to their normal position. If a resistance is attached into the circuit with an application of sinusoidal stress to the quartz, an alternating current will flow through the load, and consequently mechanical power will be converted to the electrical power. In reverse, an alternating voltage in the circuit will produce alternating stress energy (mechanical energy) in the quartz.
[0061] FIGS. 2A-2C illustrate Kelvin's model of molecules. Based on the diagram, there are two type of stress that will produce a charge separation normal to the axis: longitudinal and shear stress. If a quartz crystal is stresses along the x- or electrical axis as shown in FIG. 2B, the apex molecules are then been separated farther apart without changing the separation between the other molecules. This results in a separation of the center of gravity of the positive and negative charges, in which the positive charge moves to left while the negative charge moves to the right. The separation is still along the electric axis, but is in the opposite direction to that caused by a stress along the y-axis. Consequently, a longitudinal stress can produce charge along the electrical axis.
[0062] However, if we apply a sheer stress to the quartz as in FIG. 2C, the separation of the center of charges can occur along the mechanical axis of the crystal, such that the simple shear stress is acting normal to the direction of space separation. From the diagram, the shear stress induces the charges to be displaced form their original position. This causes the current of positive charges and negative charges to move downward and upward along the y-axis, respectively. The piezoelectric effect of quartz including the shearing stresses on the molecules in YZ and XZ plane can be quantitatively expressed as:
P.sub.X=-d.sub.11X.sub.X+d.sub.11Y.sub.Y-d.sub.14Y.sub.ZP.sub.x P.sub.Y=-d.sub.11X.sub.Y+2d.sub.14X.sub.Y
where P.sub.x is the charge per unit area on the electrode surface to the x-axis due to the applied longitudinal stresses X.sub.x and Y.sub.y; P.sub.y is the charge per unit area normal to the y-axis caused by the shearing stress X.sub.y; d.sub.11 and d.sub.14 are the piezoelectric constant, in which d.sub.11=-6.76.times.10.sup.-8 (e.s.u/dyne), d.sub.14=2.56.times.10.sup.-8 (e.s.u/dyne).
[0063] In conclusion, the piezoelectricity of materials depends on the symmetry of the crystals, i.e., if there is center of inversion in the crystal, piezoelectric effect will not occur. Quartz is one of about 20 crystal groups out of a total of 32 possible point groups that have a piezoelectric effect.
[0064] Piezoelectricity
[0065] As stated above, piezoelectricity is a linear effect where a material having the piezoelectric property becomes electrically polarized when they are strained, or where the material becomes strained when placed in an electric field. This phenomenon is also named direct piezoelectric effect. The origin of the piezoelectricity is due to the displacement of the ionic charge in a crystal structure. Under a stress condition, the charge distribution is no longer symmetrical, which leads to the formation of a net electric dipole moment not equal to zero and results in an internal electric field. Note that only a material without symmetry center can be piezoelectric.
[0066] The piezoelectric effect was first discovered in quartz, tourmaline, and Rochelle slat for the generation of electrical charge under pressure conditions. In 1935, Busch and Scherrer discovered piezoelectricity in potassium dihydrogen phosphate (KDP), which was the first major family of piezoelectric and ferroelectrics to be found. The major breakthrough of the piezoelectric materials was the discovery of barium titanate and lead zircronate titanate (PZT) family in 1940 and 1950, respectively. Currently, PZT is one of the most widely used piezoelectric materials in the world. Note that both barium titanate and PZT are based on the perovskite structure (FIG. 3), which has a general formula of ABO.sub.3.
[0067] In perovskite, the corner-sharing oxygen octahedra are linked in a cubic array with smaller cations such as Ti, Zr, Sn, Nb etc. (B-site), and larger cations such as Pb, Ba, Sr, Ca, Na, etc., filling the interstices between octahedra (A-site). Note that perovskite structure allows for multiple substitutions on the A and B-site to form complex compounds including (Ba,Sr)TiO.sub.3, (Pb,Sr)(Zr,Ti)O.sub.3, and (KBi)TiO.sub.3.
[0068] Some piezoelectric materials are also ferroelectric, particularly under their Curie temperature (Tc), which possess a spontaneous polarization that can be reversed in direction by application of an electric field over some temperature range. A ferroelectric hysteresis loop can be formed by applying an alternating electric field to cause the polarization to reverse, in which it relates the polarization P to the applied electric field E. A typical field-polarization loop is shown in FIG. 4.
[0069] The electric displacement D and the polarization P are related to each other through a linear equation:
D.sub.i=P.sub.i+.epsilon..sub.0E.sub.i
Both D and P are non-linear function of the field E. In the equation above, .epsilon..sub.0 is the permittivity of free space (8.85.times.10.sup.-12 C/V*m). Two important characteristics of the P-E loop (FIG. 4) are coercive field Ec and the remnant polarization P.sub.r., in which E.sub.c is the field at which the polarization is zero, while P.sub.r is the value of the polarization when the electric field is zero. When both P.sub.r and E.sub.c no longer vary, the loop is known as saturated. In addition, the ferroelectric hysteresis loops are frequency and temperature dependent. By the same analogy, polarization switching leads to strain-electric field hysteresis for piezoelectric materials (FIG. 5). Because of the shape, the strain-electric hysteresis loop often referred to as the "butterfly loop", in which the converse piezoelectric effect dictates that a strain results as the electric field is applied. When the field is increased, the strain is no longer linear with the field as domain walls start switching.
[0070] The possibility of piezoelectricity in a material can be further determined by the specific symmetry of the crystal unit cell. Note that all crystals can be divided into 32 point group from 7 basic crystal systems (cubic, hexagonal, rhombohedral, tetragonal, orthorhombic, monoclinic, and triclinic). Of the 32 point groups, 21 of them do not have a center of symmetry, and 20 are determined piezoelectric, which are 1, 2, m, 222, mm2, 4, -4, 422, 4 mm, -42 m, 3, 432, 3 m, 6, -6, 622, 6 mm, -62 m, 23, -43 m. Note that although it lacks a symmetry center, cubic class 432 is not piezoelectric because of its cubic symmetry. The absence of a symmetry center in these groups represents that the net movement of cations and anions as a result of stress induces a non-zero electric dipole moment in the structure. However, a piezoelectric material with randomly oriented domains is piezoelectrically inactive. In response to this, "poling" is a common method to orient the domains in the piezoelectric material by applying a static electric field to the material such that the domains rotate and switch in the direction of the electric field. During the process, the expansion and contraction of the material along the field axis and perpendicular to the field axis is obtained, respectively, as shown in FIGS. 6 and 7.
[0071] When expressing the piezoelectricity in constitutive equation, the changes of strain and electrical displacement must be considered, which both are orientation-dependent. Therefore, tensor notation is used and the reference axes are indicated in FIG. 8.
[0072] It is known that the strain and stress are described by second rank tensors S.sub.ij and T.sub.ij, respectively. The relationship between electric field, E.sub.j and the electric displacement D.sub.i is the permittivity .epsilon..sub.ij. The piezoelectric equations can be written as:
D.sub.i=.epsilon..sub.ij.sup.TE.sub.i+D.sub.ij.sub.kT.sub.jk
S.sub.ij=d.sub.ijkD.sub.k+s.sub.ij.sub.k.sup.ET.sub.jk
where d.sub.ijk is piezoelectric constant. Superscripts T and E denote the condition of constant stress and constant electric field, respectively. A conventional method to describe the crystal symmetry and the choice of reference axes (FIG. 8) is to define the poling direction as the 3-axis, the shear planes are indicated by the subscripts 4, 5 and 6 and are perpendicular to directions 1, 2, and 3, respectively. For example, a 3-subscripte tensor notation (i, j, k=1, 2, 3) can be reduced to a 2-subscripte matrix (i=1, 2, 3 and j=1, 2, 3, 4, 5, 6), and a 2-subscripte tensor notation (i, j=1, 2, 3) is simplified to a 1-subscripte notation (i=1, 2, 3, 4, 5, 6). Besides, the first subscript of the piezoelectric constant represents the dielectric displacement and the second gives the component of mechanical deformation or stress. For example, d.sub.33 indicates an electric field parallel to the poling 3-axis with axial stress along the 1-axis.
[0073] It is also known that a piezoelectric ceramic material has only one type of piezoelectric matrix regardless of the symmetry of the constituent crystals. By applying the poling, the initially isotropic status of the ceramic can be destroyed leading to a transversely isotropic state, i.e., the dipoles become oriented in a direction perpendicular to the poling direction. The symmetry elements are now in an infinite order of rotation with the axis of poling direction and an infinite set of planes parallel to the polar axis, which can be described as .infin. m m. The elastic, dielectric and piezoelectric matrices for cylindrical symmetry of poled PZT are shown in the equation below:
s 11 s 12 s 13 0 0 0 s 12 s 11 s 13 0 0 0 s 13 s 13 s 33 0 0 0 0 0 0 s 44 0 0 0 0 0 0 s 44 0 0 0 0 0 0 2 ( s 11 - s 12 ) ##EQU00002## 1 0 0 0 1 0 0 0 3 ##EQU00002.2## 0 0 0 0 d 15 0 0 0 0 d 15 0 0 d 31 d 31 d 33 0 0 0 ##EQU00002.3##
By having piezoelectric equations and the matrices above, the piezoelectricity of a poled ceramics can be described as:
D.sub.1=.epsilon..sub.1E.sub.1+d.sub.15T.sub.5
D.sub.2=.epsilon..sub.2E.sub.2+d.sub.15T.sub.4
D.sub.3=.epsilon..sub.3E.sub.1+d.sub.31(T.sub.1+T.sub.2)+d.sub.33T.sub.3
S.sub.1=s.sub.11.sup.ET.sub.1+s.sub.12.sup.ET.sub.2+S.sub.13.sup.ET.sub.3+- d.sub.31E.sub.3
S.sub.2=s.sub.11.sup.ET.sub.2+s.sub.12.sup.ET.sub.1+S.sub.13.sup.ET.sub.3+- d.sub.31E.sub.3
S.sub.3=s.sub.13.sup.E(T.sub.1+T.sub.2)+s.sub.33.sup.ET.sub.31+d.sub.33E.s- ub.3
S.sub.4=s.sub.44.sup.ET.sub.4+d.sub.15E.sub.2
S.sub.5=s.sub.44.sup.ET.sub.5+d.sub.15E.sub.1
S.sub.6=s.sub.66.sup.ET.sub.6
[0074] When considering the electromechanical effects of a piezoelectric material, the parameters that of interest are 1) piezoelectric charge coefficient (d.sub.31 and d.sub.33), 2) piezoelectric voltage coefficient (g.sub.31 and g.sub.33) the piezoelectric coupling factors (k.sub.31, k.sub.33, k.sub.p, and k.sub.t). The d-coefficient is defined as the constant between electric displacement and stress, or strain and electric field. The piezoelectric charge and voltage coefficient are related to each other by:
d.sub.mi=.epsilon..sub.nm.sup.Tg.sub.ni
where m, n=1, 2, 3 and i=1, 2, . . . 6. High d-value materials are used for actuators, and high g-value materials are applied in sensors.
[0075] A common method to measure the piezoelectric properties is known as the "direct method", in which a defined input (i.e. electric field or force) is applied to the sample, and the corresponding output is measured (i.e. deformation or charge). Displacement measurements are used to determine the magnitude and sign of the relationship between applied electric field and the strain developed (converse effect). Based on the equations above, when the sample is free to expand (or stress T.sub.k=0), the strain will be only a function of the applied field D.sub.i and the piezoelectric constant d.sub.ij can be found:
S.sub.j=d.sub.ijE.sub.i
This equation means that by having a strain versus electric filed diagram, the slope of the plot yields an average value of d.sub.ij.
[0076] Furthermore, concerning the direct method, an alternative way to measure the piezoelectric constants is based on the direct piezoelectric effect. In this method, a known load is either applied on or released from a sample at rest. The resulting charge is then recorded as a voltage across a capacitor (in parallel with the sample). Since the electric filed E.sub.i is 0, the relationship can be simplified as:
D.sub.i=d.sub.ijT.sub.j
such that, by knowing the applied stress and measuring the electric displacement, the piezoelectric constant can be determined.
Experimental
[0077] Synthesis of TiO.sub.2
[0078] The TiO.sub.2 used was synthesized by mixing titanium (iv) n-butoxide (Ti--(OC.sub.4H.sub.9).sub.4)) with toluene (C.sub.6H.sub.5CH.sub.3) and acetic acid (CH.sub.3COOH) in a molar ratio of 1:1:1. With a vigorous stirring under standard condition, the final mixture was aged at 80.degree. C. for 27 hours for gelation. Finally, the resulting product was calcined at 500.degree. C. for 4 hours to nucleate and grow the TiO.sub.2 particles.
[0079] Preparartion of Quartz
[0080] Quartz powder is obtained by grinding and crushing a naturally available quartz crystal by hand (hand-ground quartz) or by using high energy ball mill machine (ball-milled quartz).
[0081] X-Ray Diffraction
[0082] For the identification of the products, X-ray diffractometry was conducted using a Scintag Pad V Diffractometer system with a Cu K.alpha. beam (X=0.541 nm).
[0083] Transmission Electron Microscopy
[0084] Transmission Electron Microscopy (TEM) to determine morphology and electron diffraction of the materials was conducted with a Philips CM 200UT microscope with a spherical aberration coefficient (Cs) of 0.5 mm and a point-to-point resolution of 0.19 nm. The TEM is operated in the High-Resolution Transmission Electron Microscope (HRTEM) and the Selected-Area Electron Diffraction (SAED) mode at an accelerating voltage of 200 kV.
[0085] Scanning Electron Microscopy
[0086] Scanning Electron Microscopy (SEM) was conducted with a Hitachi S-3400N variable pressure microscope with a tungsten filament that delivers at least 50 nA of beam current.
[0087] UV Spectrophotometry
[0088] UV Spectrophotometry was carried out with an ultraviolet-visible spectrometer with diffuse reflectance method, Thermo Evolution-600, where the light path length was 1 cm.
[0089] Hydrogen Gas Analysis
[0090] The amount of hydrogen gas (H.sub.2) produced from water-splitting experiment was monitored using AMETEC Trace Analytical Gas Analyzer, model ta3000, equipped with and Gas Chromatograph (Shimadzu GC-14A with Flame Ionization Detector FID) as well as a Reduction Gas Detector (RGD) sensor for hydrogen detection. Nitrogen gas (N2) of 99.98% purity at a flow rate of 20 cc/min is applied as the carrier gas. The detection limit of this analyzer is 10 ppb hydrogen.
[0091] Oxygen Gas Analysis
[0092] To monitor the amount of oxygen gas (O.sub.2) being produced from the system, the oxygen concentration in solution was monitored as function of time by using Isolated Dissolved Oxygen Meter ISO.sub.2 equipped with an OXELP probe (World Precisions Instruments).
[0093] Experimental Set-Up
[0094] The experiments of water splitting to hydrogen and oxygen were carried out using sealed glass tube and samples in water under a standard condition. Glass tubes a half-inch diameter and one-foot in length were used for the experiment. The reaction cell (glass tube) was filled with nitrogen gas after adding samples of the piezoelectric material being tested. To monitor the hydrogen and oxygen concentration variation, the gas inside the cell was extracted by syringe and inject into the external hydrogen analyzer. Hydrogen and oxygen production kinetics were obtained by calculating the evolved hydrogen concentration as a function time.
[0095] The results of strained induced reaction are shown in FIG. 9, in which the evolution of H.sub.2 from pure water containing suspension of ball-milled quartz powders under a condition with and without UV irradiation. It is found the quartz powders were active when there was photon energy provided. The initial rate of H.sub.2 evolution was about 76.7 ppmh.sup.-1. The reaction reached to its maximum after 2 hours due to the glass tube volume limitation. Note that the rapid decrement of the production rate along with the large error bar might caused by instrument saturation (identified in FIG. 9 by the question mark (?)). After evacuating the reaction system and re-running the experiment (identified by the dashed line in FIG. 9), the hydrogen evolution rate was then found at 51.3 ppmh.sup.-1, and again the reaction reached the plateau after about 2 hours. After another gas evacuation at 9.sup.th hour and re-running the experiment, the hydrogen evolution rate of 8.45 ppmh.sup.-1 was obtained. Amazingly, on the other hand, when the UV light was removed, we still detected hydrogen gas from the system, indicating that the reaction remained active without UV irradiation. For example, almost the identical initial H.sub.2 evolution rate at 74.9 ppmh.sup.-1 was observed for the quartz samples under dark condition. Similar gas production rates were achieved for both UV and dark condition in the second as well as the third run, suggesting that the catalytic activity was triggered by a factor other than photo energy.
[0096] Factors that influenced the gas evolution of quartz in water were further investigated using quartz with different treatments, the results of which are illustrated in FIG. 10. As a comparison, the hydrogen production performance of HCl-washed-quartz powders was also measured using the same method. The purpose of using HCl was to remove possible impurities and Fe on the quartz surface. The initial gas production rate was found at 74.5 ppmh.sup.-1 (76.7 ppmh.sup.-1 for no HCl treatment), which has no significant different from that of quartz without any treatments. After evacuation and re-running the measurement (illustrated by the dashed line in FIG. 10), the hydrogen production rate of acid washed quartz was found at 12.9 ppmh.sup.-1(15.3 ppmh.sup.-1 for no HCl treatment). A small decrease in the gas production rate of acid washed quartz under dark condition comparing to that of no treatment quartz can be explained by the quartz surface damages caused by HCl. However, the results are in good agreement with the observation of hydrogen production performance by ball-milled quartz under UV and dark conditions.
[0097] In contrast, a system that contained no quartz was utilized for a control experiment. Predictably, this system produced no hydrogen because absence of the catalyst in the system as the production of hydrogen is the result of a non-spontaneous reaction. The photoactivity of synthetic TiO.sub.2 (produced by the sol-gel method) is also included in the plot for comparison. Note that the TiO.sub.2 here contains a single phase of anatase (FIG. 11), which is generally believed has the best photoactivity for direct-water-splitting. Compared with quartz, however, anatase TiO.sub.2 had a hydrogen production rate at 3 ppmh.sup.-1, which was much lower than that of ball-milled quartz. Furthermore, TiO.sub.2 became inactive in water for catalyzing the redox reaction once the UV light was removed.
[0098] Interestingly, no hydrogen production, or only a very small amount of hydrogen was detected for the case of twinned quartz suspension in water (FIG. 10). To investigate the reduction in the activity of twinned quartz, the structure of the twinned quartz was analyzed in more detail.
[0099] The structure of a-quartz (or low quartz) can be treated as a distortion of high-temperature .beta.-quartz (or high-quartz). In .beta.-quartz, paired helical chains of SiO.sub.2 tetrahedral spiral in the same sense around 64 or 62 screw axes parallel to c (FIG. 12). Twofold rotation symmetry within the sixfold screw is found between the two helical chins. The intertwined chains produce open channels parallel to c that appear hexagonal in projection. The space group of .beta.-quartz is either P6.sub.422 or P6.sub.222 depending on the handeness of the tetrahedral helices. When .beta.-quartz is cooled below its transition temperature at 1 bar, the expanded .beta.-quartz framework collapses to the denser .alpha.-quartz configuration, and the Si--O--Si bond angle decreased from 150.90 at 590.degree. C. to 143.60 at room temperature. The contraction of the tetrahedral can be described as the rotation of rigid tetrahedral about <100> axes through an angle .theta.. Note that .theta. is zero in .beta.-quartz and .theta. is 16.30 in a-quartz at room temperature. Based on FIG. 13, this rotation violates the twofold symmetry contained within the sixfold screw axes, and the space group symmetry decreases from P6.sub.422 to its subgroup P3.sub.121 (or from P6.sub.222 to P3.sub.221).
[0100] The .alpha.-.beta. quartz transformation yields two distinct left and right twin orientation because the tetrahedral rotation may occur in one of two senses. These two orientations are related to each other by the twofold symmetry lost during the transformation. These two equivalent twin-related orientational variants, which related each other by 180.degree., are named Dauphine twinning. FIG. 14 shows structure of a single twin boundary.
[0101] In Dauphine twinning, the quartz now becomes ditrigonal with a threefold symmetry (FIG. 14), and the electrically polarized diad axes normal to the c-axis in the two Dauphine twin orientations are rotated 180.degree. relative to each other. As a result, the piezoelectric charges induced in one set of twins by compression normal to c will cancel the electric charges built up in the other. This piezoelectricity cancellation by Dauphine twinning in quartz explains why a large amount of hydrogen production for the twinned quartz was not observed similar to that for the ball-milled quartz. The Dauphine twin boundary is consisted of a gradual change in the tetrahedral tilt angle .theta. from +16.3.degree. to -16.3.degree..
[0102] Based on the preparation method, the heating history of the twinned quartz was first at room temperature, and then heated at 700.degree. C. for 5 hours followed by cooling in air till room temperature again. Accordingly, the phase of quartz varied from a-phase at room temperature to .beta.-phase at 700.degree. C., then back to .alpha.-phase when cooling. From the discussions above, when phase transformation of .beta..fwdarw..alpha. occurred on cooling, two twin-related .alpha.-phases are formed, leading to the Dauphine twinning effect in which the piezoelectric properties of .alpha.-quartz is now disappeared. In particular, when the twinned quartz is placed in contact with water, based on the above observations, only a very small amount or no hydrogen gas is produced; compared to the ball-milled quartz, which also contained also .alpha.-phase only, but maintained a piezoelectric property, resulting in hydrogen production of 76.7 ppmh.sup.-1. These observations are applicable in both UV-illuminated and dark conditions.
[0103] In this set of experiments, the observation of large quantities of hydrogen production in both acid- and non-acid treated ball-milled quartz was confirmed. A much lower hydrogen production rate was obtained for the quartz sample without piezoelectric property.
[0104] In order to obtain more insights about the morphology and the factors that lead to the H.sub.2 evolution, XRD and TEM analysis was performed. X-ray diffraction pattern of the ball-milled quartz sample are shown in FIG. 15. The diffraction peaks are indexed according to the values reported in JCPDS card No. 25-1353. Form the pattern, it can be seen that the quartz is phase pure containing no impurities. Note that both ball-milled and none-ball-milled .alpha.-quartz exhibited identical diffraction peaks, thus the XRD pattern of ball-milled quartz fits perfectly to the XRD pattern of the .alpha.-phase.
[0105] FIGS. 16A-16B show the TEM images of the ball-milled quartz. After high energy ball milling, the creation of defects on the quartz grains can be clearly observed as the small dots in these figures. These defects deformed the quartz grains, and thus the defects can be treated similarly to or as locally applied external forces on the quartz grains. Furthermore, as explained previously, due to the lack of a symmetry center in quartz, any applied mechanical force on quartz, such as the defects, will cause a build up of charge on the surface and generate an electric potential (piezoelectric effect). In this case, the ball-milling defect induces a charge build up and potential difference on the quartz crystal surface in manner similar to that created when an external mechanical force is applied to the quartz. As a result, when water is positioned in contact with a quartz surface, the induced potential acts as a chemical driving force for the reduction reaction of water, resulting in the generation of hydrogen gases, which forms a new mechanism for direct water splitting in which the mechanical force (deformation) transformed directly into chemical force (splitting of water). This phenomenon explains the observations of large amount of hydrogen evolution of quartz suspension in water, which is independent of photo energy provided.
[0106] As illustrated in FIG. 10, twin-phase quartz powders did not have any activity for hydrogen generation. This is has been determined to be because the piezoelectric property of the quartz material was canceling out due to the twining effect, in which the overall quartz particles became charge neutral. Because of that, twin-phase quartz can no longer build up charges on the surface. As a result, when twin-phase quartz powders were suspended in water, they do not have sufficient driving force to reduce water in to hydrogen gas. This leads to the observations of small or no hydrogen production for the trials. For the HCl-washed trials, the acid only removes the impurities or Fe on the surface, but does not change any piezoelectric properties of quartz. Therefore, we were still able to detect large amount of the hydrogen from the trials of HCl-treated quartz suspensions in water. More importantly, in our system the illumination of light no longer plays a dominant role for reduction of water, which not only successfully overcomes the limitation of light-harvesting problem under UV and visible light, but also results in a system that is able to catalyze the reaction without any light energy.
[0107] As additional support for these findings, the hydrogen production reaction of ZnO suspension in water was also tested, the results of which are illustrated in FIG. 17. ZnO is a well known piezoelectric material and has been reported as being successfully used in as a nano-generator.
[0108] For the verification experiments, ball-milled ZnO powders were prepared similarly to the quartz powders tested above, with hand-ground ZnO powder samples used as a control experiment. From the data in FIG. 1, it was found that, under dark conditions, the hydrogen production rate of ball-milled ZnO is almost 12.5 times greater than that of hand-ground ZnO, at 2.39 ppmh.sup.-1 and 0.19 ppmh.sup.-1, respectively. Thus, these results confirm that, because the ball-milled ZnO grains contain many defects resulting from the method of their production, these defects allowed the build up of electric potentials on the surface of the grains. The induced electric potential on the surface was then transformed into a chemical driving force for the hydrogen production once the water was in contact with the ZnO powders. In contrast, the hand-ground ZnO powders has much lower production rate is because the grains did not contain as many defects as the ball-milled ZnO, resulting in a smaller amount of mechanical energy being transformed into chemical energy.
[0109] FIG. 18 shows the diffuse reflectance UV-Vis spectra of the quartz with various treatments including ball-milled quartz (.alpha.-phase), hand-ground quartz (.alpha.-phase), twinned quartz, and HCl-treated ball-milled quartz. All the quartz samples after treatment were white in color, had high reflectance to visible light, and had absorption of UV light at wavelengths at around 250 nm. The hand-ground quartz powders had high reflectance of wavelengths longer than 350 nm. Conversely, all the samples that were ball-milled (including acid treatment) revealed absorption at and around 360 nm. The absorption at around 360 nm is believed to be caused by local linear defects in the crystal that were created by high energy ball-milling.
[0110] Furthermore, concerning twinned quartz, an additional absorption shoulder at 550 nm was found. Integration of the twin boundary and variations of the defect density in the crystal are believed to be the factor that influenced the absorption at 550 nm. However, the illumination of light here does not play a critical role in a piezocatalytic reaction, because the transformation of the mechanical energy into the chemical driving force is the focus, such that only the piezoelectric properties of the catalyst determine if the reaction can be catalyzed by the material or not. For example, although twin-phase quartz has additional absorption at wavelength of 560 nm (FIG. 18), without the piezocatalytic effect, the hydrogen production outcome is still negligible (FIG. 10).
[0111] Theory of Piezoelectrochemical Effect Concerning the form and ability of piezoelectric materials, such as quartz, ZnO and BaTiO.sub.3, to produce or catalyze the hydrogen production reaction in an aqueous environment, because the charge that initiates the reaction is localized on the exterior surface of the material, it is desirable to maximize the surface area of these materials to consequently maximize the area available for charge build up and reaction initiation. Further, while the cause for the charge build up in these piezoelectric materials has been determined to be the result of the defects formed in the materials, because the defects are considered to function identically to mechanical forces acting on the piezoelectric materials, the surface charge on these materials can also be created through the direct application of suitable mechanical force to the material within the aqueous environment.
[0112] To maximize the available surface area of the material, there are methods currently available for synthesizing nano-fibers of the various piezoelectric materials. The advantage is that the piezoelectric material nano-fibers have extremely high flexibility and large surface area, leading to great amount of chemical potential for splitting of water.
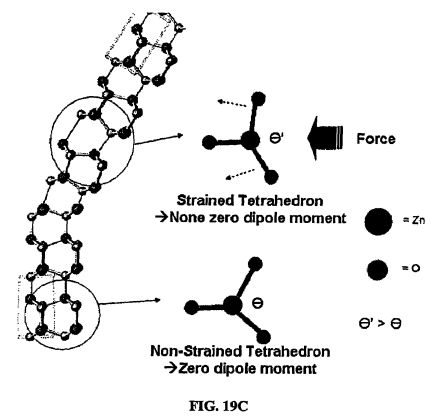
[0113] The physics and chemistry of generating hydrogen and oxygen gases from pure water arises from the combination of the piezoelectric properties of certain piezoelectric materials, such as SiO.sub.2, ZnO and BaTiO.sub.3, and the redox reaction of water. The piezoelectricity of each material arises from the lack of inversion symmetry in their crystal structures. Any deformation or strain acting on the material, such as the deformation of the Si--O structure (FIGS. 19A-19B), Zn--O tetrahedra (FIG. 19C), or the relative Ti--O positions of BaTiO.sub.3 (FIG. 19D), will cause a non-zero dipole moment in the crystal lattice. Consequently, strain-induced electrons migrate through the bulk material and a charge potential is produced on the surface of the material. Specific morphological aspects of SiO.sub.2, ZnO and BaTiO.sub.3 such as fibers and dendrites will acquire electric potentials on their surfaces if an external mechanical energy is applied that results in a bending (deformation) of the fiber or dendrite. The strain-induced electric potential formed on the fiber or dendritic surface in wet conditions (i.e. in pure water) is available for the reduction and oxidation reaction via charge transfer to species such as water molecules adsorbed on the surface (FIG. 1 9E). Note that the developed potential must be greater than the standard redox potential of water (1.23 eV) to make electrons available to initiate the redox reaction in this experiment (FIGS. 20-21). Residual charges or potentials lower than 1.23 eV will not participate in reactions to form H.sub.2 and O.sub.2 from water (FIG. 19F).
[0114] Alpha quartz with its unique piezoelectrochemical property is one potential material for direct-water-splitting for hydrogen production. The possible voltage that is generated by applying an external force on the quartz can be calculated as follows. First, assume a quartz sample has a beam-like geometry with a diameter T, and length, l, as shown in FIG. 19A. Considering the quartz fiber is under a two-end-fixed condition with proper alignment and applied force as in FIG. 19B, the maximum deflection (y) and the bending moment on the quartz fiber as a function of applied force can be calculated as:
y = 2 W ( l - a ) 2 a 3 3 EI ( l + 2 a ) 2 ##EQU00003## at x = 2 al ( l + 2 a ) 2 if a > 1 / 2 ##EQU00003.2## Maximum possible value = Wl 3 192 El ##EQU00003.3## when x = a = l a ##EQU00003.4## Maximum Bending Moment = M max = Wl 8 ##EQU00003.5##
where W=applied force; l=fiber length; a=reference point; E=modulus of elasticity of the fiber materials; I=moment of inertial.
[0115] Therefore, by having the maximum deflection and bending moment, the maximum local stress, radius of curvature, and output voltage from the piezoelectric effect of quartz can be found as follows:
.sigma. = Mz I ##EQU00004## R = EI M ##EQU00004.2## V .+-. = .+-. 3 Ty m 4 Ld ##EQU00004.3##
where .sigma.=stress, M=M.sub.Max (in Eq.4.4 ); z=fiber radius; T=fiber diameter; y.sub.m=maximum deflection from equation above; d=piezoelectric constant of quartz=(2.3 .mu.m/V).
[0116] Table 5 below lists the values of induced possible maximum voltage by deflecting the quartz fiber with various radius and lengths when 1.times.10.sup.-5 N is applied.
TABLE-US-00005 TABLE 5 Theoretical values of maximum defection and induced potential quartz fibers with different dimensions Area Young's inertia Max. Max. Fiber Mod. Radius Length Density Vol. Mass (X- def. Ind. Pot. Dim. (Pa) (m) (m) (kg/m3) (m3) (kg) sect) (m) (.+-.V) mm- 1.05E+11 1.00E-02 1.00E-01 2.67E+03 3.14E-05 8.37E-02 4.19E-06 1.19E-16 7.74E-06 level .mu.m- 1.05E+11 1.00E-05 1.00E-04 2.67E+03 3.14E-14 8.37E-11 4.19E-21 1.19E-10 7.74E+00 level nm- 1.05E+11 1.00E-08 1.00E-07 2.67E+03 3.14E-23 8.37E-20 4.19E-36 1.19E-04 7.74E+06 level *Assume 1 .times. 10.sup.-5 N force is applied
[0117] From Table 5, it is found that when a quartz fiber is in mm-scale, the maximum induced potential with 1.times.10.sup.-5 N of force applied is only about 7.74.times.10.sup.-6 V, which is impossible for the required redox potential of water at 1.23 V (FIG. 22), thus no hydrogen production. However, by scaling down the quartz fiber to .mu.m-scale (aspect ratio remained unchanged), the maximum defection becomes much greater, leading to a possible potential of .about.7.74 V and driving the direct-water-splitting process. These calculations match our observations on the quartz suspension for generation of hydrogen, and describe the basic physics of the piezoelectrochemical effect (PZEC).
[0118] Furthermore for example, considering a case of generating .+-.10.0 V is needed; the table blow (Table 6) shows the required deflection, bending moment, force, and radius of curvature by using quartz fibers in different scale.
TABLE-US-00006 TABLE 6 Theoretical values of deflection, force, bending moment, and radius of curvature for generating 10.0 V of potential on quartz fibers with different scale-level Required Required Required Deflection (m) Force(N) Bending Moment (Nm) mm-level 1.53E-10 2.02E-01 2.52E-03 micron-level 1.53E-10 2.02E-07 2.52E-12 nm-level 1.53E-10 2.02E-13 2.52E-21
[0119] Based on the above, it is believed that: (1) the nano-meter scale quartz fiber with greater amount of deflection and surface area will dramatically improve the hydrogen production rate from water; (2) a stoichiometric amount of oxygen will be produced in the piezoelectrochemcial reaction; (3) kinetics and other factors control the direct splitting of water via piezoelectrochemical effect; and (4) a quartz fiber with piezoelectrochemical properties will also be able to be applied to initiate a catalytic oxidation reaction, such as the oxidation of various organic compounds.
[0120] The above results illustrating the increased effectiveness of the quartz in nano-scale fiber form over other forms also should hold true for nano-fibers formed from other suitable piezoelectric materials.
[0121] Fabrication of Piezoelectric Material Nano-Fibers
[0122] 1. Quartz Fibers
[0123] In one exemplary method, the quartz fibers are prepared by using an ultra-microtome to cut a natural quartz crystal at a high cutting speed. In doing so, the quartz fibers can be prepared and align in different orientations by various cutting directions and speeds for improved surface area, mechanical properties, and piezoelectrochemical effect. FIG. 23 shows the quartz fibers prepared by ultra-microtome cutting in a fabric-like network. The quartz fibers are much more durable than normal quartz crystals in macroscopic scale because interlocked quartz nano-fibers are much less brittle due to its dimensions. This results a dramatic improvement on surface area and possible induced potential (thus piezoelectrochemical properties) for splitting the waters.
[0124] All the quartz nano-fibers can be characterized using X-ray diffraction, Scanning Electron Microscopy (SEM), Transmission Electron Microscopy (TEM) and associated techniques (like nano-diffraction and electron energy-loss spectroscopy) to determine the structure and chemistry of the nano-fibers while the effective surface area can be characterized using BET and BJH methods.
[0125] 2. BaTiO.sub.3 Dendrites
[0126] The BaTiO.sub.3 dendrite samples (FIGS. 24-26 and 29) of the PZEC catalyst were synthesized by a hydrothermal method. All the chemicals that were used as starting materials had a purity of 99.99%. The precursor Ti(OH).sub.4 was prepared by adding 25 mL of Ti(OC.sub.2H.sub.5).sub.4 drop-wise into 1.0M of acetic acid. The solution was settled allowing the precipitate to form in 72 hours and followed by rinsing the product with DI water and drying at 60.degree. C. The as-synthesized Ti(OH).sub.4 precursor and commercially available Ba(OH).sub.2 8H.sub.2O were then added (Ti:Ba=1:1 in molar ratio) into 0.25M NaOH. After that, the mixture in a Teflon cup with 60% capacity was stirred and sealed tightly in a stainless steel autoclave. The closed bomb (Parr-type) was maintained at 200.degree. C. for 68 hours for hydrothermal reaction. The bomb was then cooled naturally to room temperature. The resulting white precipitate was washed extensively with DI water to remove any adsorbed impurities and finally dried at room temperature.
[0127] 3. ZnO Fibers
[0128] A hydrothermal method was used to synthesize ZnO fibers (FIGS. 27-29). Hexamethylenetetramine (C.sub.6H.sub.12N.sub.4) and zinc nitrate hexahydrate (Zn(NO.sub.3).sub.2.6H.sub.2O) precursor solutions were mixed together (1:1 molar ratio) in Teflon cup with 60% capacity followed by magnetically stirring in 15 min. The mixture was then sealed tightly in a stainless steel autoclave. The closed bomb was heated at 95.degree. C. for 48 hr. After that the bomb was cooled naturally to room temperature. The final products were washed with DI water and dried at room temperature.
[0129] Hydrogen Production from Water Using Ultrasonic Vibrations and Fibers of Piezoelectric Material
[0130] In support of the above theory, testing was done utilizing zinc oxide (ZnO) micro-fibers synthesized using the bottom-up method (i.e. hydrothermal synthesis method). Nano-fibers of quartz and other materials can be fabricated using photolithography, dry-cutting and other methods, some of which were discussed previously.
[0131] The micro-fibers were positioned in a pure water aqueous environment to which a suitable ultrasonic vibration generator was connected in order to direct ultrasonic vibrations at the fibers within the aqueous environment. An identical trial utilizing a similar aqueous environment without any ZnO micro-fibers was also conducted to provide a control for the experiment. Initially, the aqueous environments were left alone in order to measure any hydrogen production from the aqueous environments. This was done for an initial forty (40) minute time period with a suitable hydrogen gas detection device such as described previously used to detect any hydrogen produced by the micro-fiber containing and control aqueous systems. After the initial time period, the ultrasonic vibration generator was activated to direct vibrations through the aqueous environment at the micro-fibers to deflect and "mechanically strain" the micro-fibers. The ultrasonic vibration generator was left active for a second forty (40) minute time period, and the hydrogen production from the system during this period was measured in the same manner as during the initial time period.
[0132] The results of this experiment are shown in FIG. 23, in which the evolution of H.sub.2 from pure water under an application of ultrasonic waves. As seen in the graph, during the initial forty (40) minute period where the ultrasonic vibration generator inactive, no hydrogen was produced in either the micro-fiber containing or control aqueous environments. Regarding the control system, no hydrogen production was detected during the second time period as well. However, when the ultrasonic generator was activated during the second time period in the system including the ZnO micro-fibers, rapid hydrogen production was obtained at an initial rate of 12.9 ppmh.sup.-1. This hydrogen gas production upon mechanical vibration of the ZnO micro-fibers in the aqueous environment agrees with the previous experiments, in which the strained ZnO powders were also active to split water into hydrogen and oxygen.
[0133] This is because, in a mechanism similar to that caused by the deformation of the structure of ZnO grains by ball milling, with regard to micro- and nano-scale fibers, ZnO fibers will build up electric potentials on the surface through deformation caused as a result in an aqueous environment, the mechanical or strain induced electric potential caused by the vibrations is transformed on the fibers into the chemical energy that is utilized to split water into hydrogen and oxygen gas.
[0134] The performance of direct water-splitting was further investigated showing the capabilities of ZnO fibers and BaTiO.sub.3 dendrites for scavenging vibrational waste energies from urban environments to generate hydrogen and oxygen gases from pure water. In order to first measure hydrogen gas production, ultrasonic wave vibrations at a frequency of 40 kHz using a Branson 5510-MT Ultrasonic Cleaner were applied to 5.0 mL of DI water in a Pyrex glass tube to determine the results of the piezoelectrochemical effect on as-synthesized ZnO fibers prepared on a Si (100) wafer of 1.times.1 cm.sup.2. The results for hydrogen gas production for the ZnO and the BaTiO.sub.3 are shown in FIGS. 30 and 32. A control experiment was also conducted with a cleaned Si wafer (1.times.1 cm.sup.2), without ZnO fibers in the system. In the first period when external vibration was used (0.about.40.sup.th minute), rapid hydrogen production was obtained at an initial rate of 3.4.times.10.sup.-3 ppm per second (ppm/s). The reaction cell was then evacuated at the 40.sup.th minute allowing a fresh run beginning at the 41.sup.st minute. Ultrasonic wave vibration was turned off at the beginning of the 41.sup.st minute, and the H.sub.2 production was measured again. It was found that hydrogen generation stopped when the ultrasonic wave vibration was turned off, leading to a negligible H.sub.2 production rate (<0.0001 ppm/s). This is similar to the control experiment (0.about.40.sup.th minute). A possible reason for the low gas concentration in the experiments without ultrasonic vibration or the control experiment could be due to contamination from air in the room.
[0135] The oxygen production performance of ZnO fibers via the piezoelectrochemical effect was also investigated. Oxygen concentration was measured in solution as a function of time as shown in FIG. 31. The response of the ZnO fibers to external vibrations was demonstrated by turning the ultrasonic wave in the system on and off. Consistent with the hydrogen production test, when ultrasonic waves were applied to ZnO fibers, oxygen concentration grew rapidly at an initial rate of 1.7.times.10.sup.-3 (ppm/s).Oxygen production stopped in the 41.sup.st to 80.sup.th minutes, corresponding to when the ultrasonic waves were turned off. ZnO fibers in DI water with applied ultrasonic vibrations evolved hydrogen and oxygen gases with a stoichiometric equivalent of H.sub.2O.sub.2=2:1. As with the previous experiments, no oxygen production was observed for the Si wafer control experiment.
[0136] Thus, based on the hydrogen and oxygen production tests utilizing the fibers of piezoelectric materials (e.g., ZnO, quartz, BaTiO.sub.3) in an aqueous environment, there is a direct conversion of mechanical energy (ultrasonic vibration) into the chemical energy (water splitting) as a result of the mechanical strain placed in the fibers. This is believed as a very important step forward to recycling the waste energy into alternative fuel in the future.
[0137] The micro- or nano-scale fibers of these materials create high levels of hydrogen production in the aqueous environment conditions as utilized in the above experiments, because the piezoelectric materials are more chemically stable, and able to generate greater electrical potential on the surface for further chemical reactions. In addition, quartz and certain other piezoelectric materials are much cheaper to obtain than other piezoelectric materials, further reducing the barriers to effective use of the piezoelectrochemical effect to generate useful energy from waste energy.
[0138] Similarly, when the external mechanical input is turned off, electrical charges will no longer accumulate on the fiber surface. Thus no sufficient potential can be used to reduce or oxidize the water molecules into hydrogen and oxygen, respectively. This is evidenced by the fact that we did not observe a rapid gas growth rate without vibration compared to the vibration mode. Our conclusions are that quartz, ZnO fibers and BaTiO.sub.3 dendrites show very good responses to the application of ultrasonic vibrations by generating H.sub.2 and O.sub.2 directly from water. Based on the gas production tests above, we have confirmed the piezoelectrochemical (PZEC) effect by using the quartz, ZnO and BaTiO.sub.3 fibers in wet conditions.
[0139] PZEC Efficiency Calculation
[0140] The efficiency of the PZEC effect can be measured as a function of fiber aspect ratio. In this case, samples with different average fiber lengths were prepared by varying the synthetic time and precursor concentration during the hydrothermal process. Each sample was immersed into DI water along with ultrasonic wave vibration during the reaction. The hydrogen production performance was monitored. The efficiency of each sample was then calculated by the ratio of produced chemical potential output over the effective mechanical energy input. The value of the output chemical energy was calculated from the observed hydrogen production rate, in which the standard reduction potential of water, 1.23 eV was used. In addition, in order to eliminate other factors such as surface area or secondary branches, we use ZnO fibers to demonstrate the efficiency calculations below and assume each fiber as a 3D tetragonal prism-shaped fiber with uniform width and height (0.4 .mu.m) on the two ends, and therefore the aspect ratio is only varied by the fiber length. Looking now at Table 8, the initial generation rate of H.sub.2 evolution is 8.56.times.10.sup.4 ppms.sup.-1, 1.30.times.10.sup.-3 ppms.sup.-1, 2.61.times.10.sup.-3 ppms.sup.-1, and 4.25.times.10.sup.-3 ppms.sup.-1 for the ZnO fibers having aspect ratio of 14.3, 16.5, 18.3, and 19.5, respectively. The system without any ZnO fibers presented was examined by the same method as a control experiment. The H.sub.2 production rate of the control experiment is negligible. It is noticed that the ZnO fiber samples with a greater aspect ratio shows a better production rate. The efficiency of converting the mechanical energy from the ultrasonic waves to chemical potential driving the water splitting by piezoelectrochemical effect can be calculated as the follows. The average output chemical potential by single ZnO fiber is
E chem = 2 n H 2 E t N A e N fiber ##EQU00005##
where n.sub.H.sub.2=hydrogen produced in moles; E.sub.t=threshold energy of water decomposition=1.23 eV; N.sub.A=Avogadro's number; e=electron volt, N.sub.fiber=number of fibers. The input elastic deformation energy generated by ultrasonic wave can be found from the bending of the fibers by assuming that all the acoustic pressure is transformed into the force for fiber deformation. Accordingly, the acoustic pressure is:
P A = 2 I .rho. c and P effective = P A 2 ##EQU00006##
where I=acoustic intensity=0.63 Wcm.sup.-2; .rho.=density of water; c=speed of light in water. It is worth to note that the reflectivity (R) of the sample glass tube against the ultrasonic wave was considered and R is found to be 0.185 (see detail calculation in the following section). In addition, we assume the ultrasonic waves propagated across the system normal to the cross-section area of the reaction cell. As a result, the input mechanical energy created by ultrasonic wave vibrations acting on the fibers is
E mech = 175 F 2 L 3 4608 YI ##EQU00007##
where F=average force acting on one fiber; L=fiber length; Y=Young's modulus, and I is the inertia of the ZnO fiber. Assuming the energy did not lost in any other form, therefore, the efficiency of converting mechanical energy to chemical energy is:
Efficiency = E chem E mech * 100 % ##EQU00008##
The math below shows one example of calculation details for the PZEC efficiency by using a typical ZnO fiber with a length of 5.68 .mu.m.
Mechanical Energy:
[0141] Acoustic Intensity from the ultrasonic generator, I.sub.0:
I 0 = Watt cm 2 = 185 ( W ) 24.5 * 12 ( cm 2 ) = 0.629 ##EQU00009## [0142] 185 W=reported value from the manufacture. [0143] 24.5.times.12=cross section area of the ultrasonic tank, in which we assume the ultrasonic wave propagates across the tank. [0144] Reflectivity, R (1) (reflectivity of the glass tube against the ultrasonic vibrations):
[0144] R = ( .rho. glass c glass - .rho. water c water .rho. glass c glass + .rho. water c water ) 2 = ( 2.8 ( g / cm 3 ) * 2 E 8 ( m / s ) - 1.0 ( g / cm 3 ) * 2.25 E 8 ( m / s ) 2.8 ( g / cm 3 ) * 2 E 8 ( m / s ) + 1.0 ( g / cm 3 ) * 2.25 E 8 ( m / s ) ) 2 = 0.185 ##EQU00010## [0145] .rho.=density of media [0146] c=speed of light in media
[0146] I.sub.1=(1-R)*I.sub.0=(1-0.185)*0.629=0.513 [0147] I.sub.1=transmitted acoustic intensity after the glass tube reflectivity [0148] Therefore, the acoustic pressure:
[0148] P effective = 2 I 1 .rho. water c water 2 = 0.513 * 1.0 * 2.28 E 8 = 1.07 E 4 ( N / m 2 ) = F A ##EQU00011## [0149] A=cross section of 5 mL water in the test tube=2.98 cm.sup.2 [0150] Thus,
[0150] F=P.sub.effective*A=1.07E4(N/m.sup.2)*2.98E-4(m.sup.2)=3.2N
[0151] Next, the cross-section area of the fiber (cm.sup.2):
A.sub.fiber=b*L=(0.4E-4)(cm)*(5.68E-4)(cm)=2.27E-8(cm.sup.2) [0152] Therefore, the fraction of force acting on a fiber can be estimated:
[0152] F fiber = F * A fiber A = 3.20 ( N ) * ( 2.27 E - 8 ) ( cm 2 ) 2.98 ( cm 2 ) = ( 2.44 E - 8 ) ( N ) ##EQU00012## [0153] The Young's Modulus of ZnO fiber is:
[0153] Y = K n L 3 192 I = 1.86 ( N / m ) * ( 5.68 E - 6 ) 3 192 * ( 2.13 E - 27 ) ( m 4 ) = 8.33 E - 8 ( Pa ) ##EQU00013## [0154] L=Fiber length [0155] K.sub.n=spring constant=1.86 (N/m) (3, 5) [0156] I=ZnO fiber inertia=2.13E-27 (m.sup.4) (3) [0157] Finally, the mechanical energy acting on fiber causing the deformation:
[0157] E mech = 175 F fiber 2 L 3 4608 YI = 175 * ( 2.44 E - 8 ) 2 ( 5.68 E - 6 ) 3 4608 * ( 8.33 E 10 ) * ( 2.13 E - 27 ) = ( 2.34 E - 15 ) ( J / fiber ) ##EQU00014##
Chemical Energy:
[0158] ( 8.56 E - 4 ) ( pp m / s ) = ( 8.56 E - 10 ) ( mol ) 24.5 ( mol / L ) * 1 1000 ( L ) = ( 3.49 E - 14 ) = n H 2 ( moles of hydrogen ) ##EQU00015## E chem = ( 3.49 E - 14 ) * 1.23 ( eV ) * ( 6.02 E 23 ) * ( 1.602 E - 19 ) ( J / eV ) * 2 ( 5.18 E 7 ) ( fibers ) = ( 1.6 E - 16 ) ( J / fiber ) ##EQU00015.2##
Overall Efficiency:
[0159] Efficiency = E chem E mech * 100 % = 160 E - 16 ( J / fiber ) 2.34 E - 15 ( J / fiber ) * 100 % = 6.9 % ##EQU00016## [0160] Finally, Table 8 summarizes the PZEC efficiency of BaTiO.sub.3 fibers and ZnO fibers as a function of fiber length.
TABLE-US-00007 [0160] TABLE 8 Rates of gas evolution and physical properties of the fibers Average H.sub.2 Rate length L Aspect (ppm/s) E.sub.chem/Fiber Y E.sub.mech/Fiber Efficiency (.mu.m) Ratio (1E-4) (1E-16) (J) (GPa) (1E-15) (J) (%) ZnO* 5.7 14.2 8.6 1.6 0.8 2.3 6.9 ZnO 6.6 16.5 13.0 2.4 1.1 2.9 8.5 ZnO 7.3 18.1 26.1 4.9 1.7 3.8 12.8 ZnO 7.8 19.5 42.5 8.0 2.2 4.4 18.0 BaTiO.sub.3** 10 25 12.5** 1.6 6.7.sup.# 4.9 3.2 *An estimate fiber number of 5.18 .times. 10.sup.7 is used in calculation based on SEM images. **An estimate fiber number of 7.7 .times. 10.sup.8 is used in calculation based on SEM images. .sup.#Young's modulus in bulk material.
[0161] FIG. 33 shows the H.sub.2 evolution from pure water by as-synthesized ZnO fibers with different average fiber length (L) under ultrasonic wave vibration. The PZEC efficiency due to different average fiber length is shown in FIG. 34. The observed chemical energy output by a single ZnO fiber with L=5.7 .mu.m in one vibration event is .about.1.6.times.10.sup.-16 J, and the effective mechanical energy input applied on the fiber was .about.2.3.times.10.sup.-15 J (see Supplementary Information for detailed calculations). The PZEC mechanical to chemical efficiency was found to be .about.6.9%. Increasing the ZnO fiber length to L=7.8 .mu.m increased reaction efficiency to .about.18%. An increase in the efficiency can be explained by the strain-induced voltage related to the curvature of the fiber. Fibers with greater lengths (L) exhibit a greater bending curvature than that of shorter fiber lengths when under the same applied force in a vibration event. Due to this property, in our ZnO fiber trials with equal mechanical vibration, longer fibers build up a higher number of voltages that exceed the water reduction potential. Therefore, the trials with a longer fiber length demonstrated an increased hydrogen production performance, providing higher efficiency for mechanical to chemical energy conversion. As a result of the above testing, though this will vary depending upon the particular piezoelectric material being utilized, the fibers of the suitable piezoelectric materials that can be utilized in generating the PZEC effect for driving redox reactions are at least 2 .mu.m in length, in order to provide sufficient length for the fibers to be deformed upon application of vibrations to the fibers. A more preferred range of lengths for the fibers is 2 .mu.m to 1000 .mu.m. With longer fiber lengths, the efficiency is increased along with the amount of flexing of the individual fibers, as well as the potential for multiple bends in the fibers, resulting in multiple reaction or nucleation sites on a single fiber.
[0162] The PZEC efficiency of BaTiO.sub.3 dendrites in water was also demonstrated through our experiments. Here, the H.sub.2 production test obtained a production rate of 1.25.times.10.sup.-2 ppm per second (ppm/s). In addition, based on SEM images, density (6.08 g/cm.sup.3) and the volume of a single BaTiO.sub.3 dendrite branch, the overall BaTiO.sub.3 dendrites mass (7.5.times.10.sup.-3 g), the estimated number of the dendrites in the system, and thus the mechanical-to-chemical conversion efficiency of the BaTiO.sub.3 dendrites with an average length of 10 .mu.m was found to be 3.2 %. BaTiO.sub.3 dendrites intrinsically have a slightly greater electromechanical coupling coefficient value (k) ((k.sub.33, BaTiO.sub.3=0.49, k.sub.33, ZnO=0.408)) and, extrinsically, a larger aspect ratio than that of ZnO fibers. This indicates a higher efficiency from the BaTiO.sub.3 dendrites expected. However, BaTiO.sub.3 dendrites are composed of branch-like structures which may limit the degree of deflections of each individual BaTiO.sub.3 branch with applied vibrations. Unlike ZnO fibers, which spread freely through a given space, BaTiO.sub.3 dendrites are bundled together in groups. As a result, the dendrites are more likely to be in contact with each other when deformation occurs, leading to partial charge cancellations and a lower gas production rate from the reaction. Morphologically, we anticipate that performance will be greatly increased by selecting chemically stable fiber and dendrite materials with greater k values, larger aspect ratio and surface areas, and ensuring the fiber and dendrites are spaced out for more bending space to avoid charge cancellations.
[0163] Using fibrous ZnO and dendritic BaTiO.sub.3 catalysts with piezoelectric properties, we have demonstrated the PZEC effect for generating H.sub.2 and O.sub.2 from water which results in a direct conversion of mechanical energy to chemical energy. Finding an optimum fiber length and introducing the optimal, e.g., resonant, frequency of ZnO and BaTiO.sub.3 for the direct water-splitting process, it may be possible to obtain a much greater H.sub.2 and O.sub.2 production rate.
[0164] Utilizing the piezoelectric fibrous samples, the phenomena demonstrated could usher in a new era in the field of recycling environmental waste energy into precious alternative chemical energy. This is because the origin of the mechanical energy for use in driving the PZEC effect could be supplied from a renewable energy source or a common waste energy source in a mechanical form, i.e. vibration, at frequencies ranging from those occurring in nature on the order of fractions of Hz, e.g., greater than 0 Hz, to natural or man-made sound or mechanical vibrations on the order of multiple Hz, e.g., from about 1 Hz to about 20 kHz, to man-made ultrasonic vibrations on the order of greater than 20 kHz. In brief, so long as the vibration is sufficient to mechanically stress or deflect the fibers to generate the electrical potential to drive the redox reaction, virtually any source of vibration can be utilized. Vibrational waste energy generated in the environment from noise, wind power, or water wave action can be scavenged or harvested as a driving force for direct water-splitting, thereby forming H.sub.2 and O.sub.2 by means of PZEC fiber arrays implanted on a suitable substrate, such as a flexible film of ZnO and Barium titanates. The piezoelectric material fibers can be positioned on the material in arrays that provide the necessary spacing between fibers to prevent any cancelation of the vibration of adjacent fibers by direct interaction of the fibers with one another. In a preferred embodiment for this application of the fibers for producing the PZEC effect to drive a redox reaction, e.g., water-splitting, the spacing is approximately from 50 nm to 20 microns. The orientation of the fibers on the substrate is less important, as the deformation of the fibers occurs as a result of the vibrations striking the fibers regardless of whether the fibers are secured to the substrate at one end, at both ends, are disposed in a co-planar configuration with regard to the substrate, or are utilized without a substrate entirety, i.e., the fibers are free floating within the reaction environment.
[0165] Application of PZEC in Other Organic Redox Reactions
[0166] Due to the ability of the piezoelectric materials to produce the necessary potential to initiate a water-splitting reaction, the same potential can be utilized as a driver for other redox reactions as well. Table 7 below lists some of the possible redox indictors that can be used to study the piezoelectrochemistry in redox reactions that could potentially be driven by the PZEC effect provided by suitable piezoelectric materials, including, but not limited to, quartz, ZnO, and BaTiO.sub.3. Reaction kinetics can be determined by evaluating the changes of organic concentrations of the components o the reaction as a function of time.
TABLE-US-00008 TABLE 7 Possible oxidation-reduction indicators for piezoelectrochemistry Color of Color of Indicator E.sup.0, V Ox. form Red. Form 2,2'-Bipyridine (Ru complex) 1.33 colorless Yellow Nitrophenanthroline (Fe 1.25 cyan Red complex) n-Phenylanthranilic acid 1.08 violet-red Colorless 1,10-Phenanthroline (Fe 1.06 cyan Red complex) n-Ethoxychrysoidine 1 red Yellow 2,2'-Bipyridine (Fe complex) 0.97 cyan Red 5,6-Dimethylphenanthroline 0.97 yellow-green Red (Fe complex) o-Dianisidine 0.85 red Colorless Sodium diphenylamine 0.84 red-violet Colorless sulfonate Diphenylbenzidine 0.76 violet Colorless Diphenylamine 0.76 violet Colorless
[0167] For example, the piezoelectric property of piezoelectric materials can potentially be utilized as a catalyst or the oxidation of organic pollutants, such as volatile organic compounds (VOC). In this situation, the positive charges on the piezoelectric materials surface can trigger the oxidation reactions for the VOC and covert the toxic chemicals into less harmful or non-toxic forms, i.e. CO.sub.2. The advantage is that, similarly to the reduction of water, the piezoelectric material itself is environmentally friendly, and can be used for VOC decomposition and waste cleanup at a very low cost.
[0168] This discovery and research can potentially have highly significant impact on energy and environmental applications based on the following: [0169] 1) a piezoelectric material suspension in water without any external energy yielded a significantly greater amount of hydrogen than commercial and current existing products or processes; because of the simplicity and robustness of the process, this novel mechanism may be ideal driving redox reactions, such as for large scale of hydrogen production and decontamination of volatile compounds in gas and liquid phase, among other suitable redox reactions; [0170] 2) the abundance of certain piezoelectric materials that can be used in the method greatly lowers the cost of utilization of this application; and [0171] 3) unlike many other methods that use or involve toxic chemicals, such as metal-organics, all of the materials in our system are environmentally friendly, in which a truly "clean energy" production can be achieved.
[0172] Various alternatives are contemplated as being within the scope of the following claims particularly pointing out and distinctly claiming the subject matter regarded as the invention.
US Patent
Application 20080223713
Photocatalyst Having Improved Quantum Efficiency and Method for Use in Photocatalytic and Photosynthetic
Photocatalyst Having Improved Quantum Efficiency and Method for Use in Photocatalytic and Photosynthetic
Xu; Huifang, et al.
Abstract -- The present invention involves increasing the quantum efficiency in titania photocatalysts for photocatalytic (oxidation of acetaldehyde) and photosynthetic (photosplitting of water) reactions by integrating the titania photocatalyst with a polar mineral having surface electrical fields due to pyroelectric and piezoelectric effects, and by adjusting the nanostructure of the photocatalyst materials. The photocatalytic reactivity of titania powder is increased due to the effect of electric field present on the surface of polar mineral material on the photocatalytic effect of commercial titania with respect to photolysis of water. Additionally, the photocatalytic performance of pure phase rutile and anatase nanostructures with well defined morphologies was found to improved with respect to certain photocatalytic reactions in comparison with non-structured titania.
U.S. Current Class: 204/157.15; 423/610; 502/232; 502/300; 502/350
U.S. Class at Publication: 204/157.15; 502/300; 502/232; 502/350; 423/610
Intern'l Class: B01J 19/12 20060101 B01J019/12; B01J 21/06 20060101 B01J021/06
Description
FIELD OF THE INVENTION
[0002] The present invention relates to photocatalysts, and more particularly to photocatalysts capable of use in heterogeneous photocatalysis to activate the photocatalyst using light energy to drive redox reactions.
BACKGROUND OF THE INVENTION
[0003] Hydrogen is widely considered to be one of the fuels of the future. It is non-polluting, renewable, and very flexible in conversion to other forms of energy. Hydrogen is viewed as a very attractive alternative to fossils fuels as a source of energy because the deposits of fossil fuels are limited and fossils fuels are widely believed to be responsible for the global warming and long-term climate change. Hydrogen is an environmentally friendly fuel the combustion of which results in the generation of water, which is neither an air pollutant nor a green house gas.
[0004] As of today, hydrogen is produced primarily through steam reforming of methane. This technique, however, results in the emission of carbon dioxide (CO.sub.2), which is a greenhouse gas. Hydrogen produced through water electrolysis also cannot be considered environmentally friendly as the electricity used is obtained from combustion of fossil fuels. The growing interest in hydrogen has resulted in the increasing need to develop hydrogen production technologies based on the utilization of renewable sources of energy, particularly solar energy.
[0005] There is also a need or an improved method or manner to deal with the growing environmental and health problems created by hazardous volatile organic compounds (VOCs) that are generated in a multitude of industrial and commercial processes.
[0006] While many different potential solutions have been developed for attempting to address these problems, the prior art attempts have fallen short of being able to completely remove these problems. For potentially addressing both of these issues, one option that has undergone significant development is the process of photocatalysis.
[0007] In particular, heterogeneous photocatalysis is a process in which light energy is used to activate a catalyst to drive a reaction. Photocatalysts are generally semiconductors which have a fully occupied valence band (VB) and an empty conduction band (CB) in their electronic structure. The valence band and the conduction band are separated by an energy gap (E.sub.g). Upon absorption of light having energy equal to or greater than the band gap, the valence electrons can become excited, causing them to overcome the energy gap and jump from the valence band into the conduction band. The resulting electron deficiencies in the valence band are called `holes` and the electron-hole pairs are referred to as the charge carriers. FIG. 1 schematically illustrates the electronic band structure of a semiconductor in ground state and that of a photoexcited semiconductor.
[0008] The photo-generated charge carriers are energy rich and this energy can be used electrically (solar cells), or chemically (photocatalytic redox reactions), or to change the catalyst surface itself (superhydrophilicity). When a semiconductor absorbs light to produce electron-hole pairs, the following processes occur: [0009] (i) the electron-hole pairs are separated within the semiconductor particle and diffuse to the surface where they can take part in redox reactions or convert to other forms of energy; [0010] (ii) the electron-hole pairs can recombine in the semiconductor resulting in the loss of energy in the form of a radiative or non-radiative transition, which is highly undesirable for catalysis.
[0011] In general, photocatalyzed reactions can be represented by the general reaction:
(O.sub.X1).sub.ads+(Red.sub.2).sub.ads.fwdarw.(TiO.sub.2+h.nu.).fwdarw.(Re- d.sub.1)+(O.sub.X2)
where the subscript ads represents the adsorbed species on the surface of the photocatalyst. If the sign of the change in Gibbs free energy (.DELTA.G.sub.o) of this reaction is negative, it is defined as a photocatalytic reaction (spontaneous or "downhill"). If .DELTA.G.sub.o is positive for the reaction, it is defined as a photosynthetic reaction where there is a net increase in the free energy of the system ("uphill"). Photo-oxidation of organic compounds like acetate, acetaldehyde etc on TiO.sub.2 surfaces are examples of photocatalytic reactions while production of H.sub.2 from H.sub.2O, CH.sub.3OH from CO.sub.2, NH.sub.3 from N.sub.2 are examples of photosynthetic reactions which are not spontaneous and need an extra input of energy.
1. Hydrogen Production Via Water Splitting
[0012] With regards to the mechanism of the reaction, the principle of photo-catalytic water decomposition makes use of a single semiconductor electrode unlike the two electrodes in photo-electrochemical decomposition. In photo-catalytic water decomposition, both the oxidation and the reduction processes take place on the surface of the semiconductor photocatalyst, which acts as both the anode and the cathode. Also, a mixture of hydrogen and oxygen evolves from the same location on the surface of the semiconductor material in contact with an electrolyte (water).
[0013] For photodecomposition of water to occur on a semiconductor material, thermodynamic considerations require that: [0014] Conduction Band minimum (E.sub.CB) should be higher (more negative on electrochemical scale) than H.sub.2/H.sub.2O level (reduction of H.sub.2O to H.sub.2). [0015] Valence Band maximum (E.sub.VB) should be lower (more positive on electrochemical scale) than H.sub.2O/O.sub.2 level (Oxidation of H.sub.2O to O.sub.2).FIG. 2 schematically represents the positions of the conduction band and the valence band compared to the water redox potentials on the electrochemical scale vs. Standard Hydrogen Electrode (SHE) and on an Eh-pH diagram at pH=0. The difference .DELTA.E.sub.1 between the CB minimum and the H.sub.2/H.sub.2O redox potential is called the driving potential for the reduction reaction and the corresponding difference .DELTA.E.sub.2 between the VB maximum and the H.sub.2O/O.sub.2 redox potential is called the driving potential for the oxidation reaction.
[0016] The mechanism for the photogeneration of hydrogen can be illustrated by considering the energetics of an n-type semiconductor/electrolyte junction. FIG. 3 shows a schematic energy diagram of the system prior to immersing the semiconductor in the electrolyte. The vertical axis represents the potential, with the top of the axis at the vacuum level and the horizontal axis represents the different components spatially. The relationship between the potential on the vacuum scale and the potential on the redox scale (SHE) is given by:
E.sub.vac=E.degree..sub.SHE+4.5 eV
For this n-type semiconductor, before contact with the electrolyte, the free electrons in the semiconductor are at a higher potential E.sub.F than those in the electrolyte E.sub.F,redox. When the semiconductor is brought into contact with the electrolyte, electrons of higher energy from the semiconductor are transferred into the electrolyte until the Fermi levels of the semiconductor and the electrolyte, E.sub.F and E.sub.F,redox equalize. This leads to the development of a positively charged region near the surface of the semiconductor, depleted of electrons, known as the depletion layer and is similar to the layer formed at a semiconductor/metal junction known as a Schottky barrier. As a consequence, the conduction and valence bands are bent near the surface of the semiconductor to establish a potential barrier preventing further transfer of electrons to the electrolyte. The depletion layer is also called the space charge (SC) layer, best shown in FIG. 4. An electric field exists in the space charge layer at the surface of the semiconductor to a depth of 5 to 200 nm. For an n-type semiconductor, the direction of the field is from the bulk of the semiconductor towards the interface. Thus, if an electron-hole pair forms in the space charge region, the electron moves towards the bulk of the semiconductor, and the hole moves towards the surface.
[0017] Thus, the electric field that forms spontaneously at the interface accomplishes electron-hole separation. A thin (a few angstroms) layer of charged ions also forms, adsorbed to the electrolyte side of the interface known as the Helmholtz layer. The ions have the opposite sign to the charge induced in the depletion layer of the solid. The corresponding change in potential across the layer, V.sub.H, effectively increases the magnitude of the band bending in the semiconductor. The band bending is thus given by:
V.sub.B=E.sub.F-E.sub.flat band
where E.sub.flat band is the chemical potential of the electrons in the semiconductor in contact with an electrolyte at which the conduction and the valence bands are flat. When the semiconductor material is irradiated, electron-hole pairs are generated inside the semiconductor which generates a photovoltage, V.sub.photo. When the charge carriers diffuse to the space charge region, due to the electric field present in the space charge region, they are separated and the electrons migrate into the bulk of the semiconductor whereas the holes migrate onto the surface of the semiconductor. This fills the depleted layer with extra positive charge which serves to shield the negative charge which was transferred to the electrolyte in the dark equilibrium situation. The band bending at the interface is reduced and E.sub.F is moved towards the flat band potential. As a result the change in potential between the surface and the bulk is reduced, until the rate of charge carrier generation by light is balanced by the rate of recombination. This is shown in FIG. 5 where the semiconductor/electrolyte junction is illuminated.
[0018] For photosplitting of water, the redox species in the electrolyte (water) are the H.sub.+/H.sub.2 and the O.sub.2/H.sub.2O systems. For electron transfer to occur from the semiconductor to the redox species, the chemical potential (E.sub.F) of the electrons in the semiconductor should be greater (higher) than the chemical potential of the electrons in the redox species (E.sub.F,redox).
[0019] If this condition is satisfied, electrons can migrate from the bulk of the semiconductor onto the surface where they can reduce the H.sub.+ ions to hydrogen gas. Similarly holes can migrate onto the surface where they can oxidize the H.sub.2O molecule into oxygen gas. Frequently, a sacrificial reducing agent like acetate or ascorbic acid is used as a donor of electrons to the semiconductor and the organic molecule itself is oxidized by the photo-generated holes.
[0020] For the reasons stated previously, the properties of interest for a semiconductor material used for water decomposition are its bandgap, flat band potential, Schottky barrier, electrical resistance, Helmholtz potential, microstructure and corrosion resistance. The performance characteristics of the semiconductor material should also include high efficiency, durability, low cost of manufacturing, low cost and ease of maintenance. In other words, for effective use in splitting water for the formation of hydrogen, a good photocatalyst material must have: [0021] a) an energy band gap which is optimum for water splitting (approximately 2 eV with conduction and valence band edges optimally placed with respect to the water redox potentials); [0022] b) strong optical absorption in the visible and ultraviolet spectral regions; [0023] c) good stability in strong electrolytes; and [0024] d) efficient charge transfer properties between the semiconductor and the electrolyte.
[0025] There are numerous materials with small bandgaps such as CdS, CdSe, PbS, MoS.sub.2 and Cu.sub.2O which absorb light in the visible region. Unfortunately these materials exhibit photoanodic corrosion in the electrolyte and are also toxic.
[0026] Many other different types of materials have been identified as being suitable for photosplitting of water and the effect of the material structure on their performance, for example, using titania nanotubes, nickel doped indium-tantalum oxide, chemically modified titania, and mixed oxide semiconductor photocatalysts. Additionally, materials with relatively wide band gaps such as TiO.sub.2, ZnO, SrTiO.sub.3 and ZnS have good photostability but limited light absorption and hence low efficiencies.
[0027] Due to oxygen vacancies, TiO.sub.2 is an n-type semiconductor. These vacancies are formed according to the reaction:
O.sub.o.sup.n.fwdarw.(TiO.sub.2).fwdarw.V.sub.o.sup.nn+2e-+1/2O.sub.2
where the Kroger-Vink defect notation is used to explain that inside TiO.sub.2, a positively (+2) charged oxide ion vacancy (V.sub.o) is formed upon the release of two electrons and molecular oxygen.
[0028] Titanium dioxide is a preferred semiconductor material to be used for this purpose that is processed primarily from ilmenite or rutile beach sand. These ores are the principal raw materials used in the manufacture of commercial-grade TiO.sub.2. TiO.sub.2 is widely used in paints, foods, and paper manufacturing as a white pigment due to its exceptionally high index of refraction. It is also used in health and beauty products as a protectant against ultraviolet (UV) light. However, TiO.sub.2 is also one of the most widely used photocatalysts because it is non-toxic, inexpensive and is stable to photo-corrosion over a wide range of pH and solutions.
[0029] The three important polymorphs of titania are brookite (orthorhombic), rutile (tetragonal) and anatase (tetragonal). In bulk phase, rutile is the thermodynamically most stable form. The structures of these three polymorphs can be discussed in terms of (TiO.sub.26-) octahedrals. The three crystal structures differ by the distortion of each octahedral and by the assembly patterns of the octahedral chains. Anatase can be regarded to be built up from octahedrals that are connected by their vertices, and in rutile and brookite, both the edges and the corners are connected. The brookite structure is not used often for experimental investigations. The crystal structures of rutile and anatase forms of titania are shown in FIG. 6.
[0030] Anatase having a band gap of 3.2 eV is the most photo-active crystal phase of TiO.sub.2. Rutile TiO.sub.2 having a band gap of 3.0 eV and a more compact crystal is less photo-active than rutile. It has been suggested that this increased photoreactivity is due to anatase's slightly higher Fermi level, lower capacity to adsorb oxygen and higher degree of hydroxylation (i.e., number of hydroxy groups on the surface). Reactions in which both crystalline phases have the same photoreactivity or rutile a higher one are also reported. The disagreement of the results may lie in the intervening effect of various coexisting factors, such as specific surface area, pore size distribution, crystal size, crystal shape and preparation methods, or in the way the activity is expressed. Also the effective mass of an electron in rutile (20 m.sub.e) is twenty times more than that of an electron in anatase (.about.m.sub.e). Due to this, the mobility of an electron in the conduction band of anatase is greater than that of an electron in the conduction band of rutile, and so can diffuse to the surface and take part in the photochemical reactions much more effectively than in rutile.
2. Oxidation of VOCs
[0031] In addition to the use of TiO.sub.2 in photosplitting of water, heterogeneous photocatalysis using TiO.sub.2 has been extensively investigated as a method to oxidize organic pollutants in water and air, including phenols, chlorinated hydrocarbons and other hydrocarbons.
[0032] There have been various reports on the complete mineralization (photocatalytic oxidation) of organic compounds to CO.sub.2 and H.sub.2O by heterogeneous photocatalysis. The application of semiconductor photocatalysis for the remediation has been used successfully for a wide variety of compounds such as alkanes, aliphatic alcohols, aliphatic and aromatic carboxylic acids, aldehydes, alkenes, phenols and some other simple aromatic compounds. A variety of metal oxide semiconductors have been tested as photocatalysts which include TiO.sub.2 (E.sub.g=3.2 eV), WO.sub.3 (E.sub.g=2.8 eV), SrTiO.sub.3 (E.sub.g=3.2 eV) and ZnO (E.sub.g=3.2 eV). However, TiO.sub.2 has proven to be the most suitable for widespread environmental applications, because it is biologically and chemically inert, resistant to photocorrosion and chemical corrosion and inexpensive. The conduction and valence bands of anatase TiO.sub.2 occur at -0.1 and +3.0 V respectively vs. SHE; i.e the holes generated by light excitation are very powerful oxidants.
[0033] The basic processes occurring in semiconductor photocatalysis for mineralization of organic compounds is shown in FIG. 7 where A denotes an acceptor and D denotes a donor of electrons.
[0034] A typical example is the oxidation of acetic acid according to the reaction:
CH.sub.3COOH+2O.sub.2.fwdarw.(TiO.sub.2+h.nu.).fwdarw.2CO.sub.2+2H.sub.2O
A variety of intermediates have been observed in the reaction such as HCO.sub.2-, CHOCO.sub.2-, HCHO, CH.sub.3OOH, CH.sub.3COOOH and H.sub.2O.sub.2. This is a downhill reaction which is catalyzed by TiO.sub.2 in presence of light. The holes produced by the photo-excitation are used for the oxidation of acetic acid whereas the electrons are transferred to O.sub.2. Both the reactions, reduction of the electron acceptor and oxidation of the pollutant molecule occur simultaneously on the surface of the photocatalyst. The slowest process determines the overall reaction rate. The radical ions formed after the interfacial charge transfer reactions can participate in several pathways in the degradation process: [0035] They may react chemically with themselves or with surface-adsorbed compounds. [0036] They may recombine by back electron transfer reactions, especially when they are trapped near the surface. [0037] They may diffuse from the semiconductor surface and participate in chemical reactions in the bulk solution.However, the detailed mechanism of photocatalytic process on TiO.sub.2 surface is still not completely understood. Nevertheless, two critical processes determine the overall quantum efficiency of interfacial charge transfer: [0038] the competition between charge-carrier recombination and trapping (picoseconds to nanoseconds). [0039] the competition between trapped carrier recombination and interfacial charge transfer (microseconds to milliseconds).An increase in either charge-carrier lifetime or the interfacial electron-transfer rate is expected to lead to higher quantum efficiency for steady state photo-catalysis. A point of contention in the oxidation mechanism is whether the valence band holes can react directly with organic compounds before they are trapped, or whether oxidation occurs indirectly via surface bound hydroxyl radicals (i.e., a trapped hole at the surface).
[0040] However, even with the ability of titanium dioxide to adequately function as a photocatalyst for the processes of both water splitting and VOC oxidation, there are some significant shortcomings concerning the performance of TiO.sub.2 in each process. More particularly, the two challenging issues in the use of titania photocatalysis for photosplitting water to produce hydrogen and for oxidizing volatile organic compounds are (i) the relatively low quantum efficiencies of the catalysts and (ii) the requirement of near UV light for photo-activation.
[0041] First, the quantum efficiency, i.e., the efficiency with which light is utilized to drive redox reactions, is inherently low in TiO.sub.2 because the processes of electron-hole generation and the recombination are much faster than the rates at which the electrons and holes are trapped and participate in redox reactions on the surface of the TiO.sub.2 particles. In addition, upon absorption of light of relatively high intensity, the number of photo-generated charge carriers is much greater than the number of electron or hole traps or surface defects in the TiO.sub.2 particles or the number of adsorbed molecules. Therefore, as the light intensity increases, the fraction of the photogenerated charge carriers taking part in the redox reactions decreases.
[0042] The second challenging issue in titania photocatalysis is the requirement of UV light for the activation of the photocatalyst. FIG. 8 shows the solar emission spectrum measured at the sea level. It can be seen from the diagram that currently, only a small fraction (less than 2.5%) of the solar radiation can be used to activate titania.
[0043] There have been numerous attempts to modify the band gap of titania to absorb the visible light present abundantly in the solar radiation. Recently, significant progress has been made in lowering the photo-threshold energy for TiO.sub.2 photoexcitation through doping with impurity atoms including N, C, S or transition metals. However, the effect of transition metal doping of titania has been somewhat controversial in literature. While certain nitrogen doped TiO.sub.2 films (TiO.sub.2-xN.sub.x) have been demonstrated to show enhanced photocatalytic activity in the visible region through photodecomposition of organic compounds methylene blue and acetaldehyde, the addition of dopants to TiO.sub.2 alters the surface characteristics, creating defects at the surface of TiO.sub.2 particles. Such sites can affect both electron-hole recombination dynamics and absorption characteristics of the TiO.sub.2 particles, greatly reducing the quantum efficiency and, therefore, the usefulness of the photocatalyst, regardless of the benefits realized in lower the photo-activation threshold for the photocatalyst.
[0044] Therefore, it is desirable to develop a photocatalyst material that can be used in performing various redox reactions, e.g., water splitting and VOC oxidation processes, but that also significantly improves the quantum efficiency of the photocatalyst. The photocatalyst should be formed in a manner that allows it to be used in these processes in the same manner as prior art photocatalysts, without any special considerations or requirements.
SUMMARY OF THE INVENTION
[0045] According to one aspect of the present invention, a photocatalyst is provided that is formed as a combination of a conventional photo-active semiconductor material and a mineral, such as a silicate material, which is not a perovskite-based ferroelectric material. The silicate material has an inherent electrical polarity that functions on the semiconductor material to enhance the separation of the electron hole pairs generated in the semiconductor, and thus increases the quantum efficiency of the semiconductor, when light is directed at the semiconductor. The silicate crystals of tourmaline and quartz are chemically stable and physically durable in both air and aqueous solution.
[0046] The efficiency of a heterogeneous photocatalytic process can be increased by (i) increasing the range and intensity absorbed by the photocatalyst i.e. the photon efficiency and (ii) increasing the separation of the photogenerated electron-hole pairs in the photocatalyst i.e. the quantum efficiency. In the scope of the present invention, the results show an increase in the quantum efficiency in titania photocatalysts for photocatalytic (oxidation of acetaldehyde) and photosynthetic (photosplitting of water) reactions. This increase in the quantum efficiency is accomplished in one manner by integrating the titania photocatalyst with a polar mineral, like tourmaline or quartz, having surface electrical fields due to pyroelectric effect (tourmaline) and piezoelectric effect (quartz). These surface electric fields can increase the photogenerated electron-hole separation in a semiconductor photo catalyst.
[0047] When titania integrated with a polar mineral is used as the photocatalyst in photosplitting of water, there is a marked increase in performance compared to using the titania photocatalyst alone. To illustrate this, photosplitting of water is conducted with these photocatalysts in solutions of various pHs. The amount of hydrogen produced from photosplitting of water increased considerably with a polar mineral-integrated titania photocatalyst compared to pure titania alone. In particular, the maximum amount of hydrogen evolved with polar mineral-integrated titania in a system using pure water as the solution is about 3 times the amount evolved when using titania alone. This enhancement in the production of hydrogen is also evident systems containing solutions of different pH values. The enhancement in the performance can be attributed to a reduction in the Schottky barrier for electrons to migrate to the surface of the semiconductor. The electric field developed in the space charge layer of a semiconductor prevents the migration of photogenerated electrons to the surface. The surface electric fields present on the polar mineral crystals can counteract this field to reduce the barrier for electron migration to the surface to take part in redox reactions. This lowering of the barrier is caused by the reduction of the band bending in the space charge layer and an increase in the chemical potential (E.sub.F) of the electrons in titania. The polar mineral crystal has oppositely charged ends which can cause the photogenerated electrons and holes to diffuse in opposite directions in a semiconductor, thus enhancing the electron-hole separation. Both the flat band potential (E.sub.fb) of titania and the hydrogen reduction reaction follow a Nernstian behavior when pH is varied. The increase in the amount of hydrogen produced at a lower pH is explained by the decrease in the overpotential of the h.e.r. at lower pH values.
[0048] According to another aspect of the present invention, the semiconductor material used in forming the photocatalyst can be formed in a manner that enhances the ability of the semiconductor material to generate the desired electron-hole pair orientation at the reactive surfaces of the photocatalyst. The process for creation of the semiconductor material enables the structure of the material to be dominated by crystal faces that have higher photocatalytic activities for reduction, oxidation or both, than prior art semiconductor materials formed in a standardized manner.
[0049] According to still another aspect of the present invention, the semiconductor materials formed to optimize the operation of the reactive surfaces on the semiconductor can be incorporated with the polar mineral to increase the quantum efficiency of the photocatalyst utilizing both mechanisms.
[0050] Numerous other aspects, features and advantages of the present invention will be made apparent from the following detailed description, taken together with the drawing figures.
BRIEF DESCRIPTION OF THE DRAWING FIGURES
[0051] The drawing figures illustrate the best mode currently contemplated of practicing the present invention.
[0052] In the drawings:
[0053] FIG. 1 is a schematic view of the stable and excited electronic band structures of a semiconductor;
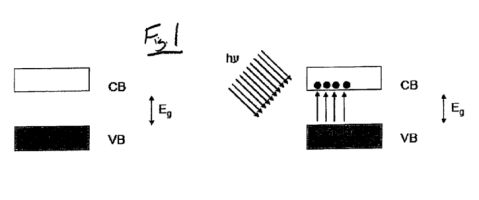
[0054] FIG. 2A is a schematic view of the relative positions of CB and VB with respect to the water redox potentials vs. SHE at pH=0:

[0055] FIG. 2B is a graph of the Eh-pH diagram of water:

[0056] FIG. 3 is a schematic view of the semiconductor/electrolyte junction before contact:

[0057] FIG. 4 is a schematic view of the CB and VB band bending in an n-type semiconductor in contact with an electrolyte;

[0058] FIG. 5 is a schematic view of n-type semiconductor/electrolyte junction when the semiconductor is irradiated;

[0059] FIGS. 6A-C are diagrammatic views of the various crystal structures of titania;

[0060] FIG. 7 is a schematic view of the basic processes occurring in semiconductor photocatalysis;

[0061] FIG. 8 is a graph illustrating the solar emission spectrum available for activation of titanium dioxide;

[0062] FIG. 9 is a schematic view of a first embodiment of the photocatalyst of the present invention;

[0063] FIG. 10 is a schematic view of the pyroelectricity in a tourmaline crystal;

[0064] FIGS. 11A-F are transmission electron microscopy images of nanosheets of anatase titanium dioxide;


[0066] FIG. 13 is a graph illustrating the evolution of hydrogen over time for a P25 photocatalyst and a P25 photocatalyst integrated with tourmaline;

[0067] FIG. 14 is a graph illustrating the evolution of hydrogen from water splitting over time for a P25 photocatalyst and a P25 photocatalyst integrated with tourmaline in a solution of pH 4.8;

[0068] FIG. 15 is a graph illustrating the evolution of hydrogen from water splitting over time for a P25 photocatalyst and a P25 photocatalyst integrated with tourmaline in solutions of pHs 9 and 8.5;

[0069] FIG. 16 is a schematic view illustrating the reduced band bending and enhanced charge separation in titania in presence of tourmaline;
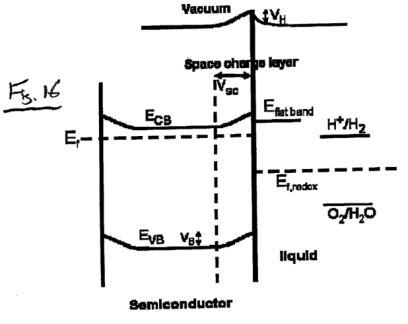
[0070] FIG. 17 is a graph illustrating the electron paramagnetic resonance spectroscopy results for various titania photocatalyst samples;

[0071] FIG. 18 is a graph illustrating the formation of CO.sub.2 from the photocatalytic oxidation of acetaldehyde using P25 titania and tourmaline integrated P25 titania;

[0072] FIG. 19 is a graph illustrating the hydrogen evolution from water splitting using P25 titania, nanostructured anatase and rutile as photocatalysts;

[0073] FIG. 20 is a graph illustrating the formation of CO.sub.2 from the photocatalytic oxidation of acetaldehyde using P25 titania, nanostructured anatase and rutile as photocatalysts;

[0074] FIG. 21 is graph illustrating effect of quartz micro-crystals on enhancing hydrogen production of photocatalysts of titania/quartz composites; and


DETAILED DESCRIPTION OF THE INVENTION
[0076] With reference now to the drawing figures in which like reference numerals designate like parts throughout the disclosure, a photocatalyst material formed according to the present invention is indicated generally at 100 in FIG. 9. In a first preferred embodiment of the photocatalyst material 100, the material 100 is formed of a conventional semiconductor material 102 and a mineral material 104.
[0077] The semiconductor material 102 can be selected from any materials having known photocatalytic properties, such as semiconductors, and in particular titanium dioxide. This semiconductor material 102 is combined with the mineral material 104 to form the structure of the photocatalyst 100 using any method or process for integrating the semiconductor material 102 and the mineral material 104 with one another. Suitable processes include, but are not limited to, simply mixing the two materials 102, 104 with one another, or by a sol-gel synthesis to produce a photocatalyst 100 having a core/shell structure where the core contains the particles of the mineral material 104 which are coated on the exterior by the semiconductor 102 particles or nanoparticles to form the shell.
[0078] The mineral material 104 used in the formation of the photocatalyst 100 is selected from those groups of minerals that have inherent electrical properties, e.g., piezoelectric or pryoelectric properties, that operate to enhance the separation of the electron-hole pairs in the semiconductor material 102 when light is directed onto the semiconductor material 102. Examples of materials of this type that are applicable for use as the mineral material 104 include, but are not limited to, silicates, such as quartz and tourmaline. Preferably, the mineral material 104 is not a ferroelectric material.
[0079] Tourmaline belongs to the group of silicate minerals called cyclosilicates. The general chemical formula of the tourmaline group, as a whole, can be expressed as:
XY.sub.3Z.sub.6(T.sub.6O.sub.18)(BO.sub.3).sub.3V.sub.3W, where: [0080] X=Na.sub.+, Ca.sub.2+, K.sub.+ or vacancy [0081] Y=Li.sub.+, Fe.sub.2+, Mg.sub.2+, Fe.sub.3+, Al.sub.3+, Cr.sub.3+, V.sub.3+, (Ti.sub.4+) [0082] Z=Al.sub.3+, Fe.sub.3+, Mg.sub.2+, Cr.sub.3+, V.sub.3+, (Fe.sub.2+) [0083] T=Si.sub.4+, Al.sub.3+, (B.sub.3+) [0084] B=B.sub.3+ or vacancy [0085] V=[O(3)] =OH.sub.-, O.sub.2- [0086] W=[O(1)] =OH.sub.-, O.sub.2-, F.sub.- [0087] and ( ) indicates minor or possible substitution.
[0088] Some of the important minerals belonging to the tourmaline group are listed below with their chemical formulae:
TABLE-US-00001 X Y Z Buergerite Na Fe3,3+ Al6 B3Si6O27(O,OH)3(OH,F) Chromdravite Na Mg3 Cr5Fe3+ B3Si6O27(O,OH)3(OH,F) Dravite Na Mg3 Al6 B3Si6O27(O,OH)3(OH,F) Elbaite Na (Li,Al)3 Al6 B3Si6O27(O,OH)3(OH,F) Ferridravite Na Mg3 Fe6,3+ B3Si6O27(O,OH)3(OH,F) Liddiocoatite Ca (Li,Al)3 Al6 B3Si6O27(O,OH)3(OH,F) Schorl Na Fe3,2+ Al6 B3Si6O27(O,OH)3(OH,F) Uvite Ca Mg3 Al5Mg B3Si6O27(O,OH)3(OH,F)
The chemical formulae listed above represent the ideal composition for the corresponding species. But, in reality, there is a limited substitution of other cations in the X, Y, Z sites. The tourmaline used in this work is Elbaite containing Lithium and Aluminum.
[0089] Tourmaline belongs to the trigonal or rhombohedral lattice crystal structures with the space group R3m. The cell dimensions of the rhombohedral lattice vary depending on the composition for each of the individual minerals belonging to the tourmaline group. In general, the cell parameter c ranges from 6.86-7.47 A.sub.0 and a ranges from 15.676-16.2 A.sub.0. The range in the cell dimensions of the tourmalines reflects the variation in their composition.
[0090] Tourmaline is a hemimorphic rhombohedral borosilicate. It is a true cyclosilicate, consisting of six-membered rings that are not connected to one another by tetrahedra as they are in other cyclosilicates such as beryl. In the six-membered rings, each silicate tetrahedron shares two of its four oxygens with adjacent tetrahedra to form (Si.sub.6O.sub.18).sub.12- rings. The apical oxygen ions of the six-membered rings point toward the analogous pole (-c) of the crystal, giving tourmaline its hemimorphic nature and polar properties. The six-membered rings are linked to triangular (BO.sub.3).sub.3- groups that lie in the same plane as the tetrahedral rings. The borate groups are oriented a three-fold axis that runs parallel to the c-axis.
[0091] Tourmaline crystals have one three-fold rotation axis and three mirror planes all of which are parallel to the c-axis. This symmetry places tourmaline in the ditrigonal pyramidal symmetry class. In this symmetry class, all of the occurring forms are open and a complete crystal in this class is made up of at least two different crystal forms. Because tourmaline forms are open and because the crystals have no center of symmetry, no mirror plane or rotation axes perpendicular to the c-axis, the rotation of axis (in this case the c-axis) is polar. By definition, as shown in FIG. 10, the positive end of the c-axis is called the antilogous pole and the negative end (-c) is called the analogous pole. These limitations on the symmetry of tourmaline necessitate that the top and bottom of a tourmaline crystal always have different forms (hemimorphic).
[0092] Tourmaline, like other minerals that possess only a single polar axis of symmetry, exhibits both pyroelectric and piezoelectric properties. Pyroelectricity is the property by which the two terminations of a heated crystal, with a unique but polar rotation axis, are oppositely charged. Upon cooling, the effect reverses. During heating, the analogous end of a tourmaline crystal becomes charged positively while the antilogous end becomes charged negatively. During cooling, after the charges developed during heating have been removed, the analogous end becomes charged negatively while the antilogous end becomes charged positively. Furthermore, when an electric field is applied along the c-axis, heating occurs when the current is directed from the analogous end toward the antilogous end, and cooling occurs if the field is directed in the opposite direction. The intensity of electrical polarity is different for differently colored tourmalines which is the result of the differences in composition.
[0093] Both true (primary) and false (secondary) pyroelectricity have been described for crystalline materials. True pyroelectricity can only develop in tourmaline and other crystalline substances having a single polar axis, while false pyroelectricity can develop in any crystalline substance that lacks a center of symmetry, e.g., quartz. False pyroelectricity is, in essence, piezoelectricity developed in response to strains caused by heating and cooling. True and false pyroelectricity cannot be distinguished easily and so the existence of pyroelectric effect can be taken only to indicate the lack of a center of symmetry, not the presence of a polar axis. Also, some minerals that have polar axes do not readily exhibit pyroelectric effects (e.g. Schorl). A permanent electric dipole or spontaneous polarization is inherent along the c-axis of tourmaline. As temperature is varied, the charge distribution in the structure shifts to produce a voltage along this axis. This voltage dissipates as atmospheric molecules are adsorbed onto the surface, so the crystal soon reverts to electrical neutrality. The primary pyroelectric coefficient is a vector property, isolated when the external electric field, applied stress and applied strain on a crystal are constant or zero. However, thermal expansion in a crystal held under such conditions establishes a strain field. Thus, a component of the measured pyroelectric coefficient is caused by the piezoelectric effect. This component, known as secondary pyroelectricity, is important as it produces between 75 and 90% of the observed pyroelectric effect in tourmaline. The experimentally measured pyroelectric coefficient is the sum of primary and secondary coefficients. Tourmaline pyroelectric coefficients are found to be ranging between 1.8-5.4 .mu.C/(m.sub.2.K). Electric fields of the order of 10.sub.6-10.sub.7 V/m exist on the surface of micron-sized tourmaline.
Experimental
1. Preparation of TiO.sub.2 Material
[0094] Degussa P25 is a commercially available highly dispersed titanium dioxide powder manufactured by Degussa. It consists of a mixture of anatase and rutile and is produced by the Chloride method. This method involves thermal decomposition (or combustion) of titanium tetrachloride vapor which is formed by reaction of titanium minerals and chlorine gas at 973-1273 K to yield TiO.sub.2. P25 TiO.sub.2 formed by this method possesses sufficient surface area and has fewer defects because of the higher production temperature and is widely used as a photocatalyst.
[0095] In addition, well aligned, pure phase anatase and rutile nanosheets are synthesized through a hydrothermal process using a precursor template. The template used is the sheet structure of K.sub.xTi.sub.xLi.sub.4-x/2O.sub.8 (denoted KTLO hereafter) which has a layered structure composed of lepidocrocite-type corrugated host layers of edge-shared Ti(IV)O.sub.6 octahedra with Li.sub.+ occupying the Ti(IV) octahedral sites in the host layers and interlayer K.sub.+ ions. The alkali metal ions in KTLO can be extracted by leaching it in an acid solution and the residual titanium sites serve as seeds for the nucleation and growth of titania in acidic medium under hydrothermal conditions. KTLO is synthesized by adding tetrabutyl titanate (Ti(OR).sub.4) drop wise to a lithium hydroxide (LiOH) aqueous solution under magnetic stirring, followed by the addition of distilled water and a potassium hydroxide (KOH) aqueous solution which acts as the mineralizer. The final mixture is adjusted such that the concentration of KOH is 1 M, and the molar ratios of Li/Ti is 2:8 while maintaining the total concentration [Li] +[Ti] =0.5 mol/L. This feedstock mixture is loaded into a Teflon lined digestion bomb and heated in an oven at 180.degree. C. for 24 hours. The as prepared KTLO product is filtered, washed with distilled water and dried in an oven. The resulting KTLO powder is characterized by X-ray Diffraction (XRD) using a Scintag Pad V diffractometer and Surface Area and Pore size Analysis using a Quantachrome Instruments NOVA4200e Surface Area & Pore Size Analyzer. For hydrothermal synthesis of anatase, 0.3120 g of KTLO is loaded into the Teflon lined digestion bomb and 30 mL of 0.5 M acetic acid (HOAc) is added to it and the whole mixture is heated at 180.degree. C. in an oven for varying amount of times. Rutile is synthesized using 30 mL of 0.5 M hydrochloric acid (HCl) as the solvent instead of the acetic acid and heated in an oven at 180.degree. C. The obtained products of nanocrystalline anatase and rutile are filtered, washed with distilled water and dried in an oven at 60.degree. C.
[0096] Transmission Electron Microscopy (TEM) of titania nanostructures is done using a Philips CM 200UT microscope with a spherical aberration coefficient (C.sub.s) of 0.5 mm and a point-to-point resolution of 0.19 nm. The TEM is operated in the High-Resolution Transmission Electron Microscope (HRTEM) and the Selected-Area Electron Diffraction (SAED) mode at an accelerating voltage of 200 kV.
[0097] TEM images of anatase nanosheets are shown in FIG. 11A-F. The images show sheets of aligned anatase nanostructures. Based on the orientation of the lattice fringes in the HRTEM images, the orientation of the crystal axes and crystallographic planes can be determined. The measured lattice d-spacing values of the fringes are 1.89 .ANG., 3.52 .ANG., and 4.75 .ANG., corresponding to {200}, {101} and {002} lattice spacing. The viewing direction can determined to be [010] and the particle surface is a (010) plane. Thus the individual nanosheets of anatase can be thought to be grown epitaxially along the [001] direction and aligned or stacked parallelly along the [100] direction to form the anatase nanostructures with a sheet like morphology. The mechanism of formation of these anatase nanostructures can be explained by the plate-like or planar morphology of the KTLO precursor from which anatase nanosheets start to form during the hydrothermal synthesis. As can be seen from the images, the nanosheets are about 30 nm wide and 50 nm long.
[0098] TEM images of aligned rutile nanorods are shown in FIG. 12A-F. Based on the orientation of the lattice fringes in the aligned rutile nanorods, the orientation and the direction of growth of the nanorods are determined. The long axial orientation of the rutile nanorod is along the [001] direction. The lattice spacing of the fringes is measured to be 3.25+0.02 .ANG. which corresponds to the {110} lattice planes of rutile crystal. The strong (110) diffraction spots compared to other diffraction spots from the lattice fringes indicate that the nanostructures are dominated by {110} crystal planes. The nanorods are about 100-150 nm in length and 30 nm in width and a couple of nanometers in thickness.
2. Preparation of Mineral Materials
[0099] Tourmaline powder is obtained by crushing and grinding a naturally available elbaite crystal. Very fine powder of tourmaline powder is obtained by the sedimentation technique. The ground tourmaline powder is dispersed in a beaker of water. The smaller (lighter) particles get suspended in the liquid while the heavier particles sink to the bottom of the beaker. The smaller particles are collected by filtration and the larger particles are again ground to obtain further finer powder and the process is repeated until very fine tourmaline powder with a narrow size distribution is obtained. From the SEM images, the tourmaline particles are found to have a size ranging from 1-5 microns.
3. Photosplitting of Water
a.) Procedures
[0100] The photosplitting of water experiments are carried out in quartz tubes of dimensions 14.times.16 mm (I.D..times.O.D.) and of length of about one feet which can be fitted with a rubber stopper at the open end to create a closed system for gases. The quartz tubes are transparent to UV light. A certain amount of the photocatalyst (titania and titania plus tourmaline) is weighed carefully and loaded into the quartz tube and 5 ml of water is added to it. The quartz tube is then closed with a rubber stopper and capped using crimps. The tubes are then flushed with dry nitrogen gas to remove the oxygen present inside and create an inert atmosphere. The tubes are placed on a shaker moving at 100 rpm and are exposed to UV light from a lamp. The source of UV light is a Spectroline ENF 280C equipped with one 8 W long wavelength (365 nm) tube with LONGLIFE filter assembly. The intensity of the light emitted is about 470 .mu.W/cm.sub.2 at a distance of 15 cm. Gas samples are collected periodically from the tubes using 1 mL syringes, for hydrogen analysis. For experiments using ascorbic acid as the electron donor, 5 mL of 200 mM of ascorbic acid solution is added to the photocatalyst in the tubes instead of water.
[0101] The amount of hydrogen gas from the photosplitting experiments is measured with an AMETEK Trace Analytical ta3000 Gas Chromatograph. The ta3000 Gas Analyzer is an isothermal gas chromatograph configured with a Reduction Gas Detector (RGD) sensor for detection of hydrogen. The operating principle of the RGD is based upon the strong absorption of UV light by mercury vapor. As a reducing species like hydrogen passes through a heated mercuric oxide bed in the detector, mercury vapor is released in direct proportion to its concentration in the sample gas. The amount of mercury vapor can be measured by its UV absorption by a photometric cell. The carrier gas used is nitrogen of 99.99999% purity at a flow rate of 20 cc/min. The detection limit of the instrument is 10 ppb hydrogen.
b.) Results
[0102] Photosplitting of water experiments were done with P25 titania, P25 titania integrated with tourmaline, nanostructured anatase and rutile phases as the photocatalysts in a solution of pure water, water at different values of pH and ascorbic acid. FIG. 13 shows the hydrogen production in parts per billion (ppb) using 5 ml of pure water as the solution. 0.02 g of P25 titania (P) is used when the photocatalyst is used alone, and 0.02 g of P25 titania is combined with an equal amount of tourmaline powder for the second system (P+T). Hydrogen production from water increased considerably when P25 titania is combined with tourmaline powder compared to using P25 titania alone. The rate of hydrogen evolution follows a trend where the rate is very high initially and gradually declines after 2 hours. The increase in the amount of hydrogen produced is not monotonic. This is due to the back reaction of hydrogen and oxygen combining to form water again. Back reaction to form water is highly undesirable and is one of the biggest problems encountered in photochemical synthesis of hydrogen from water, since the reaction is energetically favorable.
[0103] FIG. 14 shows the evolution of hydrogen using a solution of pH 4.8 with the photocatalysts. The solution pH is controlled through addition of 0.1 N HNO.sub.3. The increase in the amount of hydrogen produced in the (P+T) system compared to using P25 alone is much more enhanced at a low solution pH than in pure water. The amount of hydrogen produced is as high as 2 ppm in the (P+T) system.
[0104] FIG. 15 shows the hydrogen evolution in systems containing solutions of alkaline pHs of 8 and 9.5. The amount of hydrogen produced in the (P+T) systems is still higher than systems using P25 alone, but the total amounts of hydrogen produced are considerably lower to systems containing solutions of neutral or acidic pHs.
[0105] The reactions involved in photosplitting of water to produce hydrogen are:
4h++2H2O(liq).fwdarw.O2(gas)+4H+(anodic)
4H++4e-.fwdarw.2H2(gas)(cathodic)
The overall reaction can be written as:
2H2O(liq)+4e-.fwdarw.O2(gas)+2H2(gas)
The above reaction proceeds when 4 charge carriers diffuse from the interior of the semiconductor particle onto the surface to reduce or oxidize the adsorbed species. The electromotive force (EMF) generated by this reaction as calculated from the value of standard free energy .DELTA.G.degree..sub.(H2O) is 1.23 eV. The redox potential of the cathodic (H.sub.2O/H.sub.2) and the anodic (O.sub.2/H.sub.2O) half cell reactions vary with the pH according to the Nernst equation as shown on the Eh-pH diagram in FIG. 2B. The cathodic reactions varies as:
Eh=-0.0592 pH;
and the anodic half cell reaction varies as:
Eh=1.23-0.0592 pH.
So the redox potentials shift to more negative values (higher on the electrochemical scale) as pH increases. As explained previously, for water reduction to occur at the semiconductor/liquid interface, the conduction band has to be more negative than the redox potential of H.sub.2O/H.sub.2. Only a few semiconducting materials such as TiO.sub.2, CdS and SrTiO.sub.3 satisfy this condition. For an n-type semiconductor like TiO.sub.2, a space charge layer forms at the semiconductor/electrolyte and the electric field in this layer prevents the transfer of electrons from the interior of the semiconductor to the interface. When the interface is irradiated, the band bending at the interface is reduced and E.sub.F is moved towards the flat band potential. For electron transfer to occur from the semiconductor to the redox species, the chemical potential (E.sub.F) of the electrons in the semiconductor should be greater (higher) than the chemical potential of the electrons in the redox species (E.sub.F,redox). If this condition is satisfied, electrons can migrate from the bulk of the semiconductor onto the surface where they can reduce the H.sub.+ ions to hydrogen gas.
[0106] For P25 titania, the conduction band edge is just above the redox potential for H.sub.2O/H.sub.2. As a result, the driving potential for the reduction reaction which is defined as the difference in potential between the conduction band minimum and the redox potential of H.sub.2O/H.sub.2, is very much less. Also because of the band bending inside the semiconductor, the chemical potential of the electrons generated in the interior of the semiconductor particle might actually be lower than the H.sub.2O/H.sub.2 redox potential, such that the electrons may not be able to thermodynamically reduce the H.sub.+ ions to produce hydrogen. These two factors can explain the observed low amounts of hydrogen produced using P25 titania alone as the photocatalyst.
[0107] When P25 titania is integrated with tourmaline particles and employed as the photocatalyst, the amount of hydrogen produced increased considerably, more than by a factor of 2. Tourmaline is a polar mineral and has surface polarization at ambient temperatures. Each crystal or particle has two poles or regions of opposite charge at the ends. These surface electric fields on tourmaline can replicate the Schottky effect on metal/semiconductor junctions where in the barrier potential for the migration of charge carriers to the surface semiconductor is reduced by an applied external electric field. This is qualitatively shown in FIG. 16 where in the presence of tourmaline, the band bending in titania semiconductor particles is reduced and the conduction band in the interior of the semiconductor moves upwards. The barrier potential in titania is reduced from E.sub.B to E.sub.B1 in presence of tourmaline. Thus the chemical potential of the electrons (E.sub.F) photogenerated inside the semiconductor is higher than the H.sub.2O/H.sub.2 redox potential, and the electrons can thermodynamically reduce the H.sub.+ ions adsorbed on the surface of the semiconductor to produce hydrogen gas.
[0108] In simplest terms, the effect of surface polarization of tourmaline on titania can be explained by the opposing charges present at the either ends of tourmaline particle. For the semiconductor particles attached to the positively charged end, the electrons generated inside the semiconductor migrate outwards towards this surface, while the photogenerated holes migrate outwards towards the opposite surface. Thus the electrons and holes are driven to different locations, and consequently oxidation and reduction reactions are spatially separated. The process occurs conversely in the semiconductor particles attached to the negatively charged end towards which the holes migrate while the electrons migrate outwards towards the opposite surface. Thus more charge carriers are available for the redox reactions and hence the amount of hydrogen produced is substantially higher than in systems containing just the semiconductor photocatalyst P25.
[0109] From the figures above, it can be seen that the amount of hydrogen produced increases when the pH of the solution is 4.8 and the amount of hydrogen decreases when a more alkaline pH (8 and 9.5) is used compared to the system using pure water. As given by the equations illustrated above, the redox potentials of H.sub.2O/H.sub.2 and O.sub.2/H.sub.2O change as pH is increased. The flat band potential of the semiconductor is also demonstrated to show Nernstian behavior as pH is varied:
E.sub.CB=E.sub.CBO-0.0592 pH
Thus the driving potential which is the difference between the CB minimum and the redox potential remains constant as pH is varied. This could lead to the conclusion that the amount of hydrogen produced should not change even as the pH of the solution is varied. But there are other factors which should be considered when the pH of the solution is changed. At lower pH values, the size of the titania agglomerates increases resulting in a reduction in the surface area which can lower the photocatalytic reactivity. But as pH is lowered, the concentration of H.sub.+ in the solution increases and the coverage of hydrogen increases. Also, the overpotential of the hydrogen evolution reaction (h.e.r) which is the kinetic barrier to the electrode potential, is lower at lower values of pH and is higher at higher values of pH. The overpotential of an electrode is defined as the difference between the operating potential and the equilibrium potential. When the overpotential is low, the reaction on the electrode can proceed at potentials closer to the equilibrium potentials and represents a kinetic barrier to the reaction. Hence when the overpotential of the h.e.r is low, the amount of hydrogen produced is higher than when the overpotential of h.e.r is high in solutions of alkaline pHs.
[0110] Also titania is an amphoteric oxide which upon addition to pure water decreases the pH slightly. However, this temporal variation in pH does not affect the hydrogen evolution much. At lower pH, the surface of the oxide is covered with hydroxyl ions which results in the observed decrease in the pH. Taking into effect all these factors, pH values between 4.5 and 7 are shown to be the optimal range for hydrogen evolution. This explains the increase in the amount of hydrogen produced when solutions of pH 4.8 and pure water compared to the solutions with a higher pH values.
4. Photocatalytic Oxidation (PCO) of Acetyldehyde
a.) Procedures
[0111] The photocatalytic oxidation of acetaldehyde is carried out in quartz tubes of dimensions as described above which can be fitted with a rubber stopper at the open end to create a closed system for gases. The oxidation experiments are performed with films of titania as the photocatalyst. Titania films are made from an aqueous slurry containing 5 weight % photocatalyst. For experiments using titania integrated with fine-grained tourmaline or quartz as the photocatalyst, a 1:1 weight ratio of titania and tourmaline (or quartz) is used with the weight % of titania in the aqueous slurry being 5%. The photocatalyst films are made by coating one side of thin glass slides (dimensions 280.times.10.times.2 mm) with 2 ml of the aqueous slurry and drying them in an oven at 60.degree. C. These glass slides are then placed inside the quartz tubes and sealed with a rubber stopper and capped using crimps. The quartz tubes are then flushed with oxygen gas for 10 minutes to create an oxidizing atmosphere inside.
[0112] Acetaldehyde is a volatile organic compound with a boiling point (21.degree. C.) below the room temperature. Acetaldehyde used for the experiments is obtained from Fisher Scientific and is stored in a refrigerator in liquid form in a bottle. A stock gaseous mixture of acetaldehyde is made separately in a 100 mL glass bottle. The glass bottle is sealed with a rubber stopper and flushed with dry nitrogen for 10 minutes to remove the oxygen present inside. The glass bottle is then placed in a tray containing ice to cool it to zero degrees temperature. A 1 mL syringe with needle is also placed in the tray to be cooled down to the zero degrees. The acetaldehyde bottle is taken out from the refrigerator and placed in the tray containing ice. 0.5 mL of acetaldehyde liquid is injected with the syringe into the stock bottle. The stock bottle is then taken out from the tray with the ice to allow it to warm upto room temperature. The acetaldehyde in the bottle vaporizes at room temperature and expands to fill the glass bottle. (0.5 mL of acetaldehyde liquid expands to about 216 mL of gaseous acetaldehyde at 25.degree. C. assuming ideal gas behavior). Before the bottle is taken out of ice, the rubber stopper is pierced with a syringe needle fitted to one end of a long rubber tube and the other end of the rubber tube is immersed in a beaker containing water. As the bottle warms up to room temperature, acetaldehyde vaporizes and expands inside the bottle. The nitrogen inside the bottle is expelled through the syringe needle which is bubbled through the water in the beaker. Once the bubbling of the gas stops, the pressure inside the bottle reaches atmospheric pressure and the syringe needle is removed from the stock bottle containing pure acetaldehyde gas.
[0113] For the oxidation experiments, 1 mL of acetaldehyde gas from the stock bottle is injected into the quartz tubes containing the photocatalyst films and filled with oxygen gas. The tubes are then exposed to the UV light of wavelength 365 nm. Gas samples are collected periodically from the tubes using a 100 .mu.L syringe and analyzed in a Gas Chromatograph (GC).
[0114] The electron Paramagnetic Spectroscopy (EPR) or Electron Spin Resonance (ESR) spectroscopy technique is used to detect paramagnetic species i.e. species with unpaired electrons, generally free radicals. The basic physics of this technique is similar to NMR (Nuclear Magnetic Resonance), but instead of the spins of the atom's nuclei, the electron spins are excited. An electron has a magnetic moment, which when placed in an external magnetic field of strength B.sub.0, aligns itself parallel (lower energy) or anti-parallel to the external field (higher energy). This is called Zeeman effect and the energy separation between these two states is given by:
E=g.sub.e.mu..sub.BB.sub.0
where g.sub.e is the gyromagnetic ratio of the electron (the ratio of its magnetic dipole moment to its angular moment) and .mu..sub.B is the Bohr magneton. An electron can resonate between these two states by absorption of electromagnetic radiation of energy .orgate.hE=.DELTA.. A free electron (on its own) has a g value of 2.002319304386 (which is g.sub.e, the electronic g factor). EPR signals can be generated by changing the magnetic field B.sub.0 at a constant frequency (.orgate.) radiation and measuring the energy absorption to obtain a series of sharp peaks and troughs corresponding to different values of g at different magnetic field strengths. EPR can be used for the identification and quantification of radicals, to identify the reaction pathways involving radicals in photocatalytic reactions. EPR measurements are performed using a Bruker ER 300 EPR Spectrometer operating at X-band with a TM.sub.110 cavity. The instrument settings used are: modulation amplitude 5-10 G, time constant 5 ms, modulation frequency 100 kHz, microwave power 1-2 mW, microwave frequency 9.35 GHz and a center field of 3300 G. The samples were placed in a quartz EPR cell and immersed in liquid nitrogen in a quartz insert Dewar (77 K) and irradiated with an 8 W UV lamp through the irradiation slots of the EPR cavity.
[0115] The amount of carbon dioxide (CO.sub.2) gas from the photocatalytic oxidation experiments is measured with a Shimadzu GC-14A gas chromatograph equipped with a Flame Ionization Detector (FID) with methanizer. In gas chromatography, a gas sample is swept by a carrier gas through a column packed with a material that the different gases in the sample have different affinities for and so elute out at different times. The carrier gas used is He with a mass flow controller and the fuel gas is a mixture of air and H.sub.2. When CO.sub.2 elutes from the column, it is mixed with H.sub.2 and passed over hot zinc in the methanizer where it is reduced to CH.sub.4. The CH.sub.4 is burnt to CO.sub.2 in the H.sub.2 flame and the current produced between the anode and the cathode of the FID can be measured to give the amount of CO.sub.2 in the sample. The detection limit of the instrument with the above settings is 20 parts per thousand of CO.sub.2 gas.
b.) Results
[0116] EPR (ESR) spectroscopy has been widely used to examine paramagnetic species on TiO.sub.2 surfaces, particularly with the objective of identifying radicals formed under UV irradiation which are important in photocatalytic processes. In the process of photocatalysis, the electrons and holes generated in the irradiated particles are trapped at the surface, forming paramagnetic species. The photocatalytic reactions arise from the reaction of these radicals with some reactant molecule at the TiO.sub.2 surface. The photogenerated electrons may be trapped at several sites; titanium atoms on the surface or inside the particles, or oxygen molecules adsorbed on the surface. The photogenerated holes can be trapped at the oxygen atoms in the crystalline lattice near the particle surface or at the hydroxyl groups on the surface. FIG. 17 shows the ESR spectra obtained at 77 K from P25 titania, P25 titania with tourmaline, nanostructured anatase and rutile synthesized by the hydrothermal method.
[0117] The ESR signals are labeled as signals A and B. They are characterized by the sets of g values g.sub.1=2.0058, g.sub.2=2.01025, g.sub.3=2.0215 from signal A and g.sub.1=1.9945, g.sub.2=1.9772 from signal B. Both P25 titania and P25 titania integrated with tourmaline have strong signal A and a weak signal B. Rutile nanoplates have a very high intensity from signal B, but have a very weak signal A. Nanostructured Anatase has high intensities of both signals A and B. A review of the literature suggests that signal A can be attributed to the holes trapped on or near the particle surface, and signal B can be attributed to electrons trapped at the particle surface.
[0118] In anatase, photoproduced holes are trapped at the lattice oxygen atoms located in the subsurface layer of the hydrated anatase. This radical has the structure Ti.sub.4+O.sub.-.Ti.sub.4+OH.sub.- and has the set of g values g.sub.1=2.004, g.sub.2=2.012, g.sub.3=2.016. Signal A corresponds well to this signal in the g values and the shape, and the surface of the samples are covered with hydroxyl groups. From this consideration, signal A can be assigned to the Ti.sub.4+O.sub.-.Ti.sub.4+OH.sub.- radical. This shows that the surface hydroxyl group plays an important role in photocatalytic oxidation reactions.
[0119] Signal B originates from the electrons trapped at or inside the particle surface. It was reported that Ti.sub.3+ is formed on TiO.sub.2 powders by trapping the photogenerated electrons. The g values of Ti.sub.3+ were reported to be below 2. The g values of 1.9945 and 1.9772 from signal B can be attributed to Ti.sub.3+. The difference between the g values of the surface Ti.sub.3+ and those of the inside Ti.sub.3+ are very small. Although it is difficult to predict the location of Ti.sub.3+ radicals only from the g values, it is generally assumed that Ti.sub.3+ formed inside the particles acts as a recombination center and reduces the activity of the photocatalyst whereas the Ti.sub.3+ formed on the surface of the particles increases the photoactivity.
[0120] P25 titania is a mixture of anatase and rutile, dominated by the anatase component (84%). Both P25 titania and P25 titania integrated with tourmaline show a strong signal A which arises from the trapped holes and a weak signal B which arises from the trapped electrons. Thus it can be expected that both these samples show a higher activity for photocatalytic oxidation compared to photocatalytic reduction, because of the presence of excess trapped holes. Rutile nanoplates show a weak signal A, but a very strong signal B suggesting that the rutile particles have excess trapped electrons at the surface which can take part in the photocatalytic reduction reactions. Anatase nanostructures show strong signals of both A and B indicating that a large number of photogenerated holes and electrons are trapped near the particle surface which can undergo oxidation and reduction reactions. Thus the anatase sample is expected to show a high activity for both photocatalytic reduction and oxidation reactions.
[0121] From the ESR spectra in FIG. 15, it can be seen that nanostructured anatase sample shows very strong signals A and B whereas the rutile sample shows a very strong signal B, but a weak signal A. P25 titania and tourmaline integrated P25 titania photocatalysts show a strong signal A, but a very weak signal B. As explained previously, signal A arises from the trapped holes on the surface of the photocatalyst particle which take part in the oxidation reactions whereas signal B arises from the trapped electrons on the photocatalyst surface sites which take part in the reduction reactions. It can be inferred from the ESR spectra that nanostructured anatase will show a high activity for both oxidation ad reduction reactions since it has strong signals A and B, nanostructured rutile will show a high activity for reduction because of the presence of a strong signal B, but a moderate or weak activity for oxidation because of a very weak signal A. P25 titania is expected to show a high activity for oxidation because of strong signal A, but a very low activity for reduction because of a very weak signal B. Photochemical reactivity of anatase and rutile depends on the surface orientation (hkl of the surface on which the redox reaction is taking place) of the photocatalyst particle or the film. Different surface energy levels of the conduction and valence bands are expected for different crystal faces of TiO2 because of the atomic arrangements characteristics of the faces. The difference in the energy levels drives the electrons and holes to different crystal faces, leading to separation of electrons and holes resulting in different photocatalytic activities for different crystal faces. It has been concluded that the oxidation and reduction sites on rutile particles are on the {011} and {110} faces respectively, and, on {001} and {011} face respectively for anatase particles. These surfaces are thought to be especially reactive because of the presence of four-coordinate and five-coordinate Ti atoms on faces due to surface termination, which can act as surface reaction sites. P25 titania is a mixture of predominantly anatase and rutile phases with the bulk particles having random surface orientations. Nanostructured anatase is dominated by the {101}, {001} and {100} crystal faces whereas the rutile nanorods are dominated by the {110} and {001} crystal surfaces.
[0122] The conduction and valence bands of anatase TiO.sub.2 occur at -0.1 and +3.0 V respectively vs. SHE; i.e. the holes generated by light excitation are very powerful oxidants. Acetaldehyde is a common contaminant in indoor air and is also formed during PCO of ethanol. Acetaldehyde can be mineralized completely to produce CO.sub.2 as the final product by photocatalytic oxidation. FIG. 16 shows the formation of CO.sub.2 from the oxidation of acetaldehyde on photocatalyst films made of P25 titania and P25 titania integrated with tourmaline. The levels of CO.sub.2 in the atmosphere are about 380 ppm, and in the laboratory, they are about 600-700 ppm.
[0123] The amount of CO.sub.2 formed is very similar in case of both the photocatalysts, with the P25 titania being slightly more active and producing more CO.sub.2 in the initial period. Both photocatalysts are very active initially and the rate of CO.sub.2 formation gradually decreases. As discussed previously, the ESR signal A from trapped holes in photocatalysts P25 titania and P25 titania with tourmaline is substantial indicating they can be very powerful catalysts for PCO. The trapped holes react with the surface hydroxyls to form the hydroxyl radicals. One of the proposed mechanism for PCO of acetaldehyde is direct decomposition to CO.sub.2 according to the following reactions:
*OH.sub.-+h+.fwdarw.OH
CH3OCHO+OH*.fwdarw.CH3C*O+H2O
CH3C*O+O2.fwdarw.CH3C(O)OO*
2CH3C(O)OO*.fwdarw.2CH3C(O)O*+O2
CH3C(O)O*.fwdarw.CH3*+CO2
Another minor reaction mechanism involves through the formation of acetic acid:
CH3CHO+OH*.fwdarw.[CH3CHOHO*] a*
[CH3CHOHO*] a*.fwdarw.CH3CHOHOa*
CH3CHOHOa*+O2.fwdarw.CH3COOH+HOO*
The water molecules adsorbed on the surface of the photocatalysts causes band bending in the semiconductor as explained previously. This band bending pushes the valence band lower or more positive on the electrochemical scale increasing greatly the oxidation potential of the photogenerated holes. But in presence of tourmaline, the surface electric fields present on tourmaline crystals reduce the band bending in the semiconductor slightly. So the oxidation potential of the photogenerated holes is slightly reduced. This explains the amount of CO.sub.2 formed, being a little lower in the initial period of PCO when using P25 titania with tourmaline as the photocatalyst compared to using P25 titania alone. But the decrease in the band bending of the semiconductor due to polarity of the tourmaline grains is very small compared to the overall oxidation potential (.about.3 eV) of the holes that this effect is very little. Eventually, the amount of CO.sub.2 formed is comparable to that formed using P25 titania alone as the photocatalyst. Acetaldehyde can be completely mineralized to CO.sub.2. The acetaldehyde decomposition reaction is
CH3OCHO+5/2O2.fwdarw.2CO2+2H2O
The amount of acetaldehyde is added is 1 mL (.about.25 parts per thousand). The amount of CO.sub.2 formed is very little after the initial rapid rate of formation. This is due to the decomposition of all the acetaldehyde and there is no more acetaldehyde available for consumption. Photocatalysts can be deactivated after a certain time resulting in no formation of any more CO.sub.2. This deactivation of catalysts is due to the poisoning of the catalyst. This poisoning of the catalyst is thought to be due to the decomposition of acetaldehyde to form stable surface species on titania or the due to the formation of trimeric condensation products, higher molecular weight compounds and coke by the reaction of the methyl radical with acetaldehyde.
[0124] FIG. 19 shows the evolution of hydrogen from pure water when nanostructured anatase and rutile are used as the photocatalysts. For reference, the amount of hydrogen evolved with P25 titania is also included. The amount of hydrogen evolved and the rate of hydrogen evolution are similar for anatase and rutile though rutile is marginally more active than anatase. The amount of hydrogen evolved is also higher than with tourmaline integrated P25 titania photocatalyst and a lot higher than with the P25 titania photocatalyst. In fact, the maximum amount of hydrogen evolved with nanostructured anatase and rutile (2000 ppb) is about 4 times higher than the maximum amount of hydrogen (500 ppb) evolved with the P25 titania photocatalyst. The rate of hydrogen evolution is high initially and gradually decreases with time.
[0125] FIG. 20 shows the formation of CO.sub.2 during PCO of acetaldehyde by nanostructured anatase and rutile phases. For reference, PCO of acetaldehyde using the P25 titania is also included. The anatase nanosheets show a very high activity for oxidation of acetaldehyde and a high initial rate of formation of CO.sub.2. In contrast, the rutile phase shows only a moderate activity for the oxidation to CO.sub.2 and the rate of formation of CO.sub.2 is very less compared to the anatase phase. The rate decreases gradually with time for both the anatase and rutile. In case of anatase, the formation of CO.sub.2 decreases because of the complete mineralization of acetaldehyde while in case of rutile, the formation of CO.sub.2 decreases even when there is acetaldehyde present in the tube. This is probably due to the deactivation of the rutile photocatalyst in the manner described in the previous section.
[0126] The results of oxidation and reduction experiments presented above agree well with the conclusions for nanostructured anatase and rutile photocatalysts based on the EPR data obtained on these photocatalysts. The morphology of anatase particles is dominated by {001} and {100} crystal faces and thus shows a strong photocatalytic activity for both oxidation and reduction reactions as evidenced by the strong signals A and B in the ESR spectrum and the results in the photosplitting of water and PCO of acetaldehyde. Thermodynamically stable anatase crystals are dominated by {101} faces that are symmetry identical and less reactive. The morphology of rutile phase is dominated by {110} and {001} crystal faces which show a high activity only for reduction reactions as evidenced by a strong signal B and a weak signal A in the ESR spectrum and the results in the photosplitting of water and PCO of acetaldehyde.
[0127] Thus, the quantum efficiency of a photocatalyst can also be increased by the production of the semiconductor/photocatalyst material in a manner that provides a nanostructure having crystal faces with the desired activity.
[0128] The results from quartz-titania composites also indicate coated quartz crystals can enhance both hydrogen production from water (FIG. 21) and photocatalytic oxidation of VOCs (FIG. 22). Coating either quartz micro-crystals or tourmaline micro-crystals will enhance the photocatalytic reaction, and reduce amount of photocatalysts.
[0129] Other applications of the present invention involve the use of sol-gel synthesis to produce photocatalysts having a core/shell structure where the core contains the quartz or tourmaline particles which are coated on the outside (shell) with the titania nanoparticles, photocatalysts coated on micro-crystals of quartz and tourmaline, and composites of photocatalysts with micro-crystals with electrical polarity. This way, the effect of the electrical polarity of tourmaline or quartz particles can be spread across as many titania nanoparticles as possible. Or increased performance of the photocatalysts in photoreduction and photooxidation processes. Another area of application of the present invention is in the field of photo-voltaic (PV) solar cells where the effect of these polar minerals on the efficiency of the cell will improve the performance of the solar cell. Solar cells use solar energy to produce electricity by spatial separation of the photogenerated electrons and holes in the semiconductor material. The electrical polarity of tourmaline and quartz can enhance the electron-hole separation and increase the efficiency of the cell considerably.
[0130] Still other applications of the present invention involve increasing the photon-efficiency in titania in addition to the increase in quantum efficiency accomplished in the present invention. Titania is a wide band gap semiconductor and can absorb only a small portion of the solar spectrum. Photon efficiency can be increased by reducing the band gap by doping or increasing the absorption of light of longer wavelengths. The effect of doping transition metals like Ni, Cu, Nb, N etc into titania (anatase and rutile) or titania nanotubes to produce an additional absorption peak in the visible light wavelength range can be incorporated into the photocatalysts of the present invention using the polar mineral materials and the nanostructured anatase and rutile titania components.
[0131] Various additional embodiments of the present invention are contemplated as being within the scope of the following claims, particularly pointing out and distinctly claiming the subject matter regarded as the invention.